How to use Blitz Brent Ozar First Responder Kit
This post is in my draft very long time, I have not get good time to write in better way. I will be updating this periodically.
You can download it from website https://www.brentozar.com/first-aid/, unzip it and run all SP starts with SP*. I have learnt most from GitHub https://github.com/BrentOzarULTD/SQL-Server-First-Responder-Kit
I have used DBAData database to create all scripts and load data.
======================
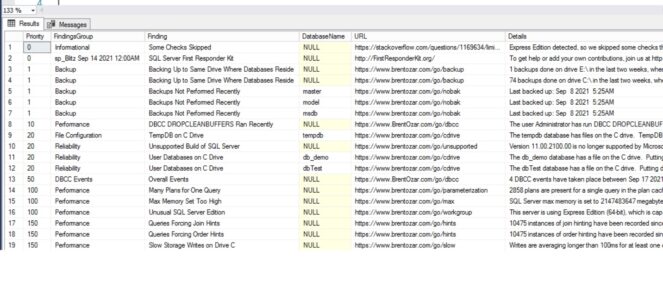
- SP_Blitz — Easy way to get server level setting and health check
--sp_Blitz
use DBAData
go
/*Check only the priority id up to 50*/

exec sp_Blitz @IgnorePrioritiesAbove = 50-- Default
Important parameters
–@Help = 1 — explains the rest of sp_Blitz’s parameters, plus the output columns as well.
–@IgnorePrioritiesAbove = 50 — excludes lower-priority alarms like informational alerts. (You can use any priority level here.)
–@CheckUserDatabaseObjects = 0 — turns off database checks like heaps and triggers. This makes sp_Blitz run way faster on systems with hundreds of databases.
To load the data into a DB:
@OutputServerName, @OutputDatabaseName, @OutputSchemaName, @OutputTableName — you can write sp_Blitz’s results to a central server for easier reporting, or just to a DBA utilities database on the same server.
I always load output to a table, it is very easy to group by and look at important Finding & FindingsGroup column data.
exec sp_Blitz --@OutputServerName='',
@OutputDatabaseName='DBAData', @OutputSchemaName='dbo', @OutputTableName='Blitz'

SELECT Finding FROM [dbo].[Blitz] group by Finding
SELECT FindingsGroup FROM [dbo].[Blitz] group by FindingsGroup

select * from [dbo].[Blitz] where FindingsGroup in ('Performance','Security','Reliability')
— It stores the skip data into the passing DBs & tables, you need to insert the skip values into the passing Dbs.
USE DBAData;
GO
CREATE TABLE dbo.BlitzChecksToSkip (ServerName NVARCHAR(128), DatabaseName NVARCHAR(128), CheckID INT);
/* This example skips all checks on the server named Skippy: */

INSERT INTO dbo.BlitzChecksToSkip
(ServerName, DatabaseName, CheckID)
VALUES('Skippy', NULL, NULL);
GO

/* This example skips all checks on the database named HorribleDB: */
INSERT INTO dbo.BlitzChecksToSkip
(ServerName, DatabaseName, CheckID)
VALUES(NULL, 'HorribleDB', NULL);
GO

/* This example skips check #42 on all servers, all databases, you can get this by looking the IDs in the website */
INSERT INTO dbo.BlitzChecksToSkip
(ServerName, DatabaseName, CheckID)
VALUES(NULL, NULL, 42);
GO

sp_Blitz
@SkipChecksDatabase = 'DBAData',
@SkipChecksSchema = 'dbo',
@SkipChecksTable = 'BlitzChecksToSkip';
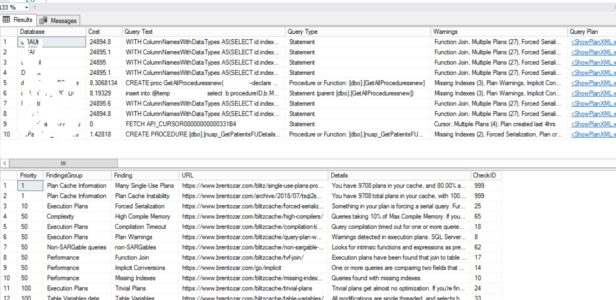
2. SP_BlitzCache — Find the query in cache, you can easily find waits, query plan, query hash, even if you find/ feel some query / SP is causing PSP issue, where you do not have control, you can remove that from cache. I used this for one of our SharePoint application, whenever we get slowness in site, clear the SP from cache, not the entire cache.
exec sp_BlitzCache --default
Important parameters
–@SortOrder – find the worst queries sorted by reads, CPU, duration, executions, memory grant, or recent compilations. Just use sp_BlitzCache @SortOrder = ‘reads’ for example.
–@Top – by default, we only look at the top 10 queries, but you can use a larger number here like @Top = 50. Just know that the more queries you analyze, the slower it goes.
–@ExpertMode = 1 – turns on the more-detailed analysis of things like memory grants. (Some of this information is only available in current SP/CUs of SQL Server 2012/2014, and all 2016.)
–@ExportToExcel = 1 – excludes result set columns that would make Excel blow chunks when you copy/paste the results into Excel, like the execution plans. Good for sharing the plan cache metrics with other folks on your team.
–@Help = 1 – explains the rest of sp_BlitzCache’s parameters, plus the output columns as well.
Read here –https://www.brentozar.com/responder/get-top-resource-consuming-queries/
By default it will sort by CPU time, you can use paste the plan to share your plan https://www.brentozar.com/pastetheplan/
exec sp_BlitzCache @help=1 -- To see the parameters
Important parameters https://github.com/BrentOzarULTD/SQL-Server-First-Responder-Kit#sp_blitzcache-find-the-most-resource-intensive-queries
Example:
@DatabaseName = ‘db’
@SortOrder = ‘reads’ or ‘CPU’ — executions ,xpm ,recent compilations ,memory grant ,writes etc
— It will take the top 50 high reads
exec sp_BlitzCache @SortOrder = ‘reads’, @top =50
— get more columns with plan compile, memory grants, free single plan from cahche etc for that DB alone.
exec sp_BlitzCache @DatabaseName = ‘db_texting’, @ExpertMode = 1
/*
@Top = 10 – by default, you get 10 plans, but you can ask for more. Just know that the more you get, the slower it goes.
@ExpertMode = 1 – turn this on, and you get more columns with more data. Doesn’t take longer to run though.
@ExportToExcel = 1 – turn this on, and it doesn’t return XML fields that would hinder you from copy/pasting the data into Excel.
@IgnoreSystemDBs = 0 – if you want to show queries in master/model/msdb. By default we hide these.
@MinimumExecutionCount = 0 – in servers like data warehouses where lots of queries only run a few times, you can set a floor number for examination.
*/
exec sp_BlitzCache @OutputDatabaseName='DBAData', @OutputSchemaName='dbo', @OutputTableName='sp_BlitzCache_Results_test'

exec sp_BlitzCache @DatabaseName = 'tandem', @ExpertMode = 1 ,@OutputDatabaseName='DBAData', @OutputSchemaName='dbo', @OutputTableName='sp_BlitzCache_Results'
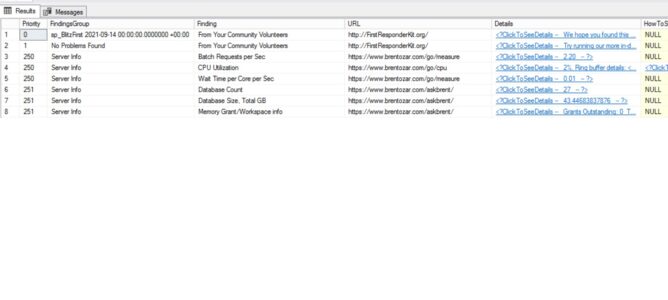
3. SP_BlitzFirst — This will give you quick idea of the server.
exec sp_BlitzFirst --default
Important parameters
–@ExpertMode = 1 – doesn’t do more in-depth checks, but DOES return a whole lot more data, including sections on wait stats, file stats, and Perfmon counters. Calls sp_BlitzWho at the start & end too so you can see which queries were running at those times.
–@SinceStartup = 1 – displays wait stats, file stats, and Perfmon counters since the SQL Server started up.
–@Seconds = 5 – by default, we take a 5-second sample of activity, but you can take a longer sample if you want to run a load test or demo.
— Storing sp_BlitzFirst Results in a Table
exec sp_BlitzFirst @ExpertMode = 1 -- Best one to know the server
exec sp_BlitzFirst @SinceStartup = 1 --
exec sp_BlitzFirst @CheckProcedureCache = 1

EXEC sp_BlitzFirst @OutputDatabaseName = 'DBAData', @OutputSchemaName = 'dbo', @OutputTableName = 'BlitzFirstResults'

EXEC sp_BlitzFirst @AsOf = '2017-05-15 23:00:12.707', @OutputDatabaseName = 'DBAData', @OutputSchemaName = 'dbo', @OutputTableName = 'BlitzFirstResults'

EXEC sp_BlitzFirst
@OutputDatabaseName = 'DBAData', @OutputSchemaName = 'dbo', @OutputTableName = 'BlitzFirstResults'
,@OutputTableNameFileStats ='BlitzFirstResults_FileStats' -- contents of sys.dm_io_virtual_file_stats
,@OutputTableNamePerfmonStats ='BlitzFirstResults_PerfmonStats' -- contents of sys.dm_os_performance_counters
,@OutputTableNameWaitStats ='BlitzFirstResults_WaitStats'-- contents of sys.dm_os_wait_stats, with common harmless waits filtered out
— For example, this query will give you the totals for a 10-minute time window:
DECLARE @CheckDateStart VARCHAR(50) = '2016-08-09 13:40 -07:00';
DECLARE @CheckDateEnd VARCHAR(50) = DATEADD(MI, 10, CAST(@CheckDateStart AS DATETIMEOFFSET));
SELECT wait_type, SUM(wait_time_ms_delta / 60 / 1000) AS wait_time_minutes, SUM(waiting_tasks_count_delta) AS waiting_tasks
FROM dbadata.dbo.BlitzFirstResults_WaitStats_Deltas d
WHERE d.CheckDate BETWEEN @CheckDateStart AND @CheckDateEnd
AND ServerName = 'WIN-BJJP8BNV8QA\SQL2016'
GROUP BY wait_type
HAVING SUM(waiting_tasks_count_delta) > 0
ORDER BY 2 DESC;
SELECT object_name, counter_name, MIN(CheckDate) AS CheckDateMin, MAX(CheckDate) AS CheckDateMax,
MIN(cntr_value) AS cntr_value_min, MAX(cntr_value) AS cntr_value_max,
(1.0 * MAX(cntr_value) - MIN(cntr_value)) / (DATEDIFF(ss,MIN(CheckDate), MAX(CheckDate))) AS BatchRequestsPerSecond
FROM dbadata.dbo.BlitzFirstResults_PerfmonStats d
WHERE d.CheckDate BETWEEN @CheckDateStart AND @CheckDateEnd
AND ServerName = 'WIN-BJJP8BNV8QA\SQL2016'
GROUP BY object_name, counter_name
ORDER BY 1, 2;
SELECT DatabaseName, TypeDesc, FileLogicalName, DatabaseID, FileID,
MIN(CheckDate) AS CheckDateMin, MAX(CheckDate) AS CheckDateMax,
MAX(num_of_reads) - MIN(num_of_reads) AS Reads,
(MAX(bytes_read) - MIN(bytes_read)) / 1024.0 / 1024 AS ReadsMB,
ISNULL((MAX(bytes_read * 1.0) - MIN(bytes_read)) / NULLIF((MAX(num_of_reads) - MIN(num_of_reads)),0) / 1024, 0) AS ReadSizeAvgKB,
ISNULL((MAX(io_stall_read_ms) - MIN(io_stall_read_ms)) / NULLIF((MAX(num_of_reads * 1.0) - MIN(num_of_reads)), 0), 0) AS ReadAvgStallMS,
MAX(num_of_writes) - MIN(num_of_writes) AS Writes,
(MAX(bytes_written) - MIN(bytes_written)) / 1024.0 / 1024 AS WritesMB,
ISNULL((MAX(bytes_written * 1.0) - MIN(bytes_written)) / NULLIF((MAX(num_of_writes) - MIN(num_of_writes)),0) / 1024, 0) AS WriteSizeAvgKB,
ISNULL((MAX(io_stall_write_ms) - MIN(io_stall_write_ms)) / NULLIF((MAX(num_of_writes * 1.0) - MIN(num_of_writes)), 0), 0) AS WriteAvgStallMS
FROM [DBAData].dbo.BlitzFirstResults_FileStats d
WHERE d.CheckDate BETWEEN @CheckDateStart AND @CheckDateEnd
AND ServerName = 'WIN-BJJP8BNV8QA\SQL2016'
GROUP BY DatabaseName, TypeDesc, FileLogicalName, DatabaseID, FileID
HAVING MAX(num_of_reads) > MIN(num_of_reads) OR MAX(num_of_writes) > MIN(num_of_writes)
ORDER BY DatabaseName, TypeDesc, FileLogicalName, DatabaseID, FileID;
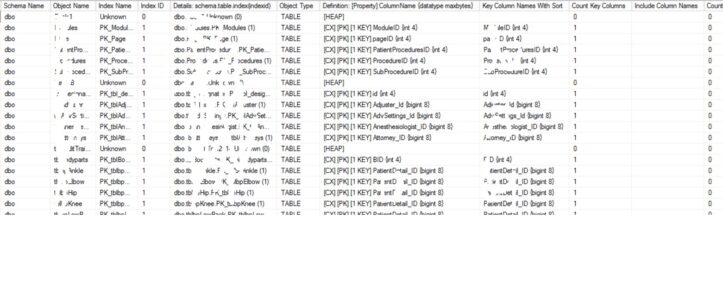
4. SP_BlitzIndex — To get overall indexes of each databases and in depth view like, seek, scan count and auto T-SQL code for create missing index and drop an existing index etc. As a DBA always we need to verify existing table index and create accordingly, do not blindly drop indexes, developers may used as hint.
exec sp_BlitzIndex --default
Important parameters
–@GetAllDatabases = 1 – runs index tests across all of the databases on the server instead of just your current database context. If you’ve got more than 50 databases on the server, this only works if you also pass in @BringThePain = 1, because it’s gonna be slow.
–@DatabaseName, @SchemaName, @TableName – if you only want to examine indexes on a particular table, fill all three of these out.
–@SkipPartitions = 1 – goes faster on databases with large numbers of partitions, like over 500.
/*
@Mode – options are:
0 (default) – basic diagnostics of urgent issues
1 – summarize database metrics
2 – index usage detail only
3 – missing indexes only
4 – in-depth diagnostics, including low-priority issues and small objects
@Filter – only works in @Mode = 0. Options are:
0 (default) – no filter
1 – no low-usage warnings for objects with 0 reads
2 – only warn about objects over 500MB
@ThresholdMB = 250 – number of megabytes that an object must be before we display its data in @Mode = 0.
@Help = 1 – explains the rest of sp_BlitzIndex’s parameters.
*/
exec sp_BlitzIndex @GetAllDatabases = 1
exec sp_BlitzIndex @GetAllDatabases = 1, @bringthepain=1 -- It will give the missing indexes and unused indexes
Example: 6 uses; Impact: 76.3%; Avg query cost: 4249.9661
Thanks to Brent Ozar’s and team for the great scripts.


