Performance tuning is a tricky part. We need to analysis all points of view. Sometimes it is an easy fix and can be solved in a minute and sometimes it take a day or more to find and fix.
I received many emails for performance tuning help. It has a variety of questions, that how can we tune a query and how to find out what is going on in the server, since my application team is does not give a slow running code. The query only slowdown in some time period. My server is banging all time above 95% of resources.
Nowadays, every business has a tool that tiger an alert that resource (CPU, RAM) goes beyond the threshold, that’s mostly from server/Infra team and it’s easy to pull a month or a year report from the server and can ask DBAs, why would the server running always with high resources for the past few days/ months.
It’s always a changeling job for DBAs to tune their system, we even keep all maintenance jobs like re-indexing and statistics update OR adding more RAM, CPU will not help, there are many things can come up. All we need to know, how to gather the information from server, database and code point of view and analysis them one by one.
Most of the time poorly written and designed query and schema will be the issue. Why I am saying so, you will come to know after reading this post.
(I mean the poorly build code is, it is not written in a set based, bad schema design, no indexes used in the where, join clause, pulling all the data even if it has a some column for filtering, high fragmentation, out of stats & parameter sniffing etc.)
We need to use techniques and need to capture the exact issue.
To cover this post, will make me to write some other post as well. Please refer the following post as well to get some more idea on the tuning.
Capturing the SQL server queries by using Whoisactive
Capturing the SQL server queries by using server side trace
Tune query by looking execution plan and effective of the index creation
The technique I/we DBAs mostly use: F&F – Find and Fix.
- Whoisactive powerful script – This will capture everything, what are all running on the server/ DB side, if we did not have much information from the application team use this.
- SQL server execution plan – Once, you have found the code, which is taking more time, go and run in the SSMS with actual execution plan and see what is going on behind the screen. Even, the Whoisactive has plan info, if you pass the @get_plans = 1 parameter.
I am classifying in three parts to get a clear picture on this.
- Server level analysis and tuning
- Database level analysis and tuning
- Query level analysis and tuning
Before Whoisactive and sp_blitz, I tend to check perfmon and the size of the database, server and database level parameter changes, more DMVs etc. The two scripts give more control to DBAs.
There is no rule that, we should check first something and second something so on. Like (Execution plan, index used or not, fragmentation, count (*) table, stats ect..)
It’s always depends on environment. In some cases, the query might run for more than 10 hours or SP has 100 lines of code or the query might behave differently in runtime etc. We might take a help of an estimated plan to know the query without actual run OR take a look at query line by line.
Server and Database level analysis and tuning
More or less the server and database level checks are same. In the deeper it will take to query level only. That is what we keep saying the best practice of t-SQL writing will help the system at the top.
In common, we mostly get unknown parameter, I mean we need to find why the resource usages are peak, without having any information.
- Check the SQL server error log
EXEC Sp_readerrorlog 0
The error log is important to check, which logs all the information.
- Check the overall top wait type of the server, since from the last reboot
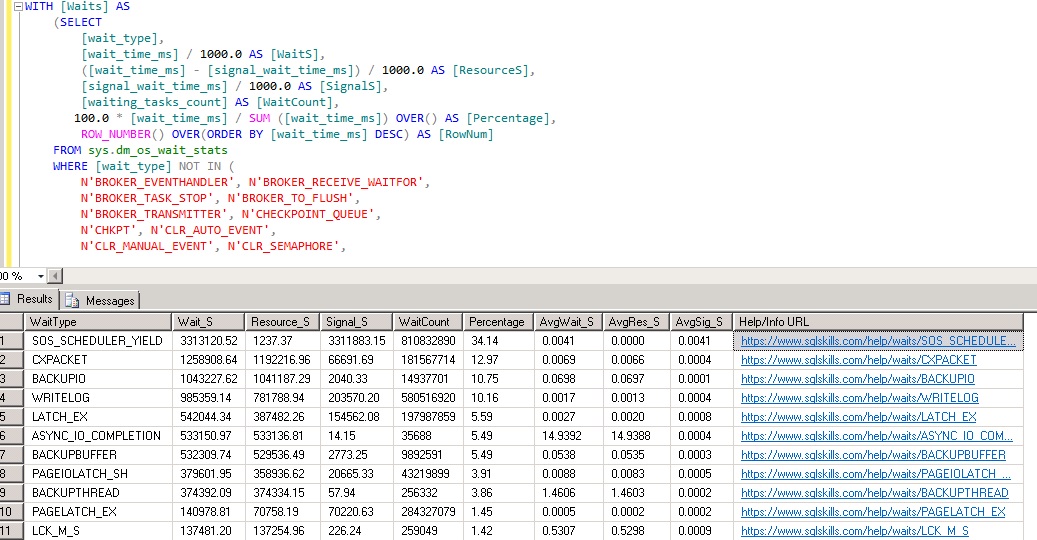
This is a fantastic script from Paul Randal, which shows the overall wait type percentage and additionally the explanation of each wait URL.
WITH [Waits] AS
(SELECT
[wait_type],
[wait_time_ms] / 1000.0 AS [WaitS],
([wait_time_ms] - [signal_wait_time_ms]) / 1000.0 AS [ResourceS],
[signal_wait_time_ms] / 1000.0 AS [SignalS],
[waiting_tasks_count] AS [WaitCount],
100.0 * [wait_time_ms] / SUM ([wait_time_ms]) OVER() AS [Percentage],
ROW_NUMBER() OVER(ORDER BY [wait_time_ms] DESC) AS [RowNum]
FROM sys.dm_os_wait_stats
WHERE [wait_type] NOT IN (
N'BROKER_EVENTHANDLER', N'BROKER_RECEIVE_WAITFOR',
N'BROKER_TASK_STOP', N'BROKER_TO_FLUSH',
N'BROKER_TRANSMITTER', N'CHECKPOINT_QUEUE',
N'CHKPT', N'CLR_AUTO_EVENT',
N'CLR_MANUAL_EVENT', N'CLR_SEMAPHORE',
-- Maybe uncomment these four if you have mirroring issues
N'DBMIRROR_DBM_EVENT', N'DBMIRROR_EVENTS_QUEUE',
N'DBMIRROR_WORKER_QUEUE', N'DBMIRRORING_CMD',
N'DIRTY_PAGE_POLL', N'DISPATCHER_QUEUE_SEMAPHORE',
N'EXECSYNC', N'FSAGENT',
N'FT_IFTS_SCHEDULER_IDLE_WAIT', N'FT_IFTSHC_MUTEX',
-- Maybe uncomment these six if you have AG issues
N'HADR_CLUSAPI_CALL', N'HADR_FILESTREAM_IOMGR_IOCOMPLETION',
N'HADR_LOGCAPTURE_WAIT', N'HADR_NOTIFICATION_DEQUEUE',
N'HADR_TIMER_TASK', N'HADR_WORK_QUEUE',
N'KSOURCE_WAKEUP', N'LAZYWRITER_SLEEP',
N'LOGMGR_QUEUE', N'MEMORY_ALLOCATION_EXT',
N'ONDEMAND_TASK_QUEUE',
N'PREEMPTIVE_XE_GETTARGETSTATE',
N'PWAIT_ALL_COMPONENTS_INITIALIZED',
N'PWAIT_DIRECTLOGCONSUMER_GETNEXT',
N'QDS_PERSIST_TASK_MAIN_LOOP_SLEEP', N'QDS_ASYNC_QUEUE',
N'QDS_CLEANUP_STALE_QUERIES_TASK_MAIN_LOOP_SLEEP',
N'QDS_SHUTDOWN_QUEUE', N'REDO_THREAD_PENDING_WORK',
N'REQUEST_FOR_DEADLOCK_SEARCH', N'RESOURCE_QUEUE',
N'SERVER_IDLE_CHECK', N'SLEEP_BPOOL_FLUSH',
N'SLEEP_DBSTARTUP', N'SLEEP_DCOMSTARTUP',
N'SLEEP_MASTERDBREADY', N'SLEEP_MASTERMDREADY',
N'SLEEP_MASTERUPGRADED', N'SLEEP_MSDBSTARTUP',
N'SLEEP_SYSTEMTASK', N'SLEEP_TASK',
N'SLEEP_TEMPDBSTARTUP', N'SNI_HTTP_ACCEPT',
N'SP_SERVER_DIAGNOSTICS_SLEEP', N'SQLTRACE_BUFFER_FLUSH',
N'SQLTRACE_INCREMENTAL_FLUSH_SLEEP',
N'SQLTRACE_WAIT_ENTRIES', N'WAIT_FOR_RESULTS',
N'WAITFOR', N'WAITFOR_TASKSHUTDOWN',
N'WAIT_XTP_RECOVERY',
N'WAIT_XTP_HOST_WAIT', N'WAIT_XTP_OFFLINE_CKPT_NEW_LOG',
N'WAIT_XTP_CKPT_CLOSE', N'XE_DISPATCHER_JOIN',
N'XE_DISPATCHER_WAIT', N'XE_TIMER_EVENT')
AND [waiting_tasks_count] > 0
)
SELECT
MAX ([W1].[wait_type]) AS [WaitType],
CAST (MAX ([W1].[WaitS]) AS DECIMAL (16,2)) AS [Wait_S],
CAST (MAX ([W1].[ResourceS]) AS DECIMAL (16,2)) AS [Resource_S],
CAST (MAX ([W1].[SignalS]) AS DECIMAL (16,2)) AS [Signal_S],
MAX ([W1].[WaitCount]) AS [WaitCount],
CAST (MAX ([W1].[Percentage]) AS DECIMAL (5,2)) AS [Percentage],
CAST ((MAX ([W1].[WaitS]) / MAX ([W1].[WaitCount])) AS DECIMAL (16,4)) AS [AvgWait_S],
CAST ((MAX ([W1].[ResourceS]) / MAX ([W1].[WaitCount])) AS DECIMAL (16,4)) AS [AvgRes_S],
CAST ((MAX ([W1].[SignalS]) / MAX ([W1].[WaitCount])) AS DECIMAL (16,4)) AS [AvgSig_S],
CAST ('https://www.sqlskills.com/help/waits/' + MAX ([W1].[wait_type]) as XML) AS [Help/Info URL]
FROM [Waits] AS [W1]
INNER JOIN [Waits] AS [W2]
ON [W2].[RowNum] <= [W1].[RowNum]
GROUP BY [W1].[RowNum]
HAVING SUM ([W2].[Percentage]) - MAX( [W1].[Percentage] ) < 95; -- percentage threshold
GO
See the results: SOS_SCHEDULER_YIELD – 34%, CXPACKET – 13% waits, Do you think which means we need to add more CPU, Since the wait type indicates there is a high CPU, No, it does not mean that we need to go and add more CPU, It means further analysis needed to find the query which is waiting for those waits and why it is waiting and how can we make that do not wait. Yes, it can be tuned and the wait type will automatically reduce.
- Check the currently running sessions
select db_name (r.database_id),r.command,r.wait_resource,s.status,s.session_id,
r.blocking_session_id,r.last_wait_type,r.open_transaction_count,
* from sys.dm_exec_sessions s join sys.dm_exec_requests r
on s.session_id =r.session_id
where s.session_id >=51 and s.status <>'sleeping'and s.session_id <>@@SPID
--and r.blocking_session_id<>0
- Check the server and database level parameter default and changes
Use, Brent Ozar’s script https://www.brentozar.com/blitz/
It is an awesome script, which will help us to quickly analysis the server and database level non default parameter checks with suggestion etc. They have improved a lot. Please check the link and provide the email address and other details. They will send you the ZIP file location to your email address.
- Check the database level running query by DMVs OR Whoisactive
The best way is to use Whoisactive or there are many DMVs, just do some googling.
- Use the server side traces to capture the information of particular events
Upcoming post: I am going to write, how to collect the queries by using server side trace.
Query level tuning and code re-write
Query level tuning is more important, most of the time poorly built queries eats up all the resources, even if you have loads of CPU and RAM and no fragmentation and with updated stats.
There are some cases that, we get in real time we need to speed up the code without an actual run.
The following step is not exactly same that, you should follow in all the time. I just used this to show more information for this particular post.
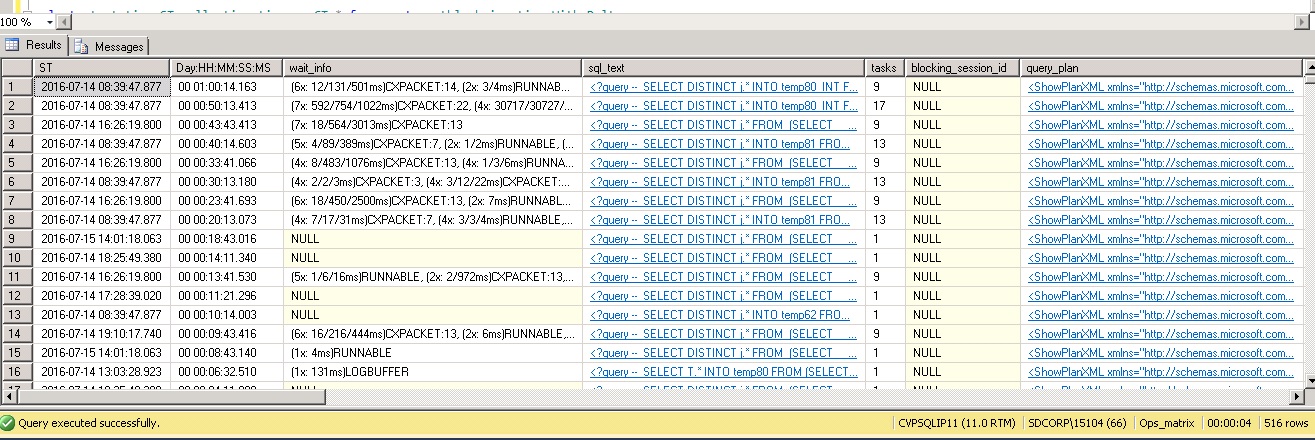
I captured this query by using “Whoisactive”. And there are many like this. And all cannot be shown here. See the wait type and it is almost matching with server over all wait.
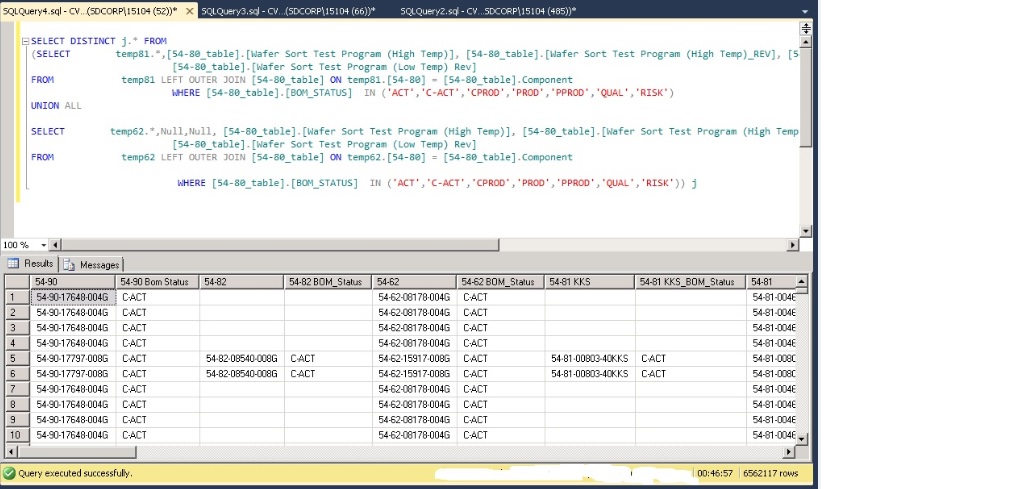
I just took the third query, see how it performs and can be tuned and rewrite better.
It is a simple union all with join two tables. It does not have a clustered index, since there is no candidate/ high selectivity column for a clustered index.
SELECT DISTINCT j.* FROM
(SELECT temp81.*,[54-80_table].[Wafer Sort Test Program (High Temp)], [54-80_table].[Wafer Sort Test Program (High Temp)_REV],
[54-80_table].[Wafer Sort Test Program (Low Temp)], [54-80_table].[Wafer Sort Test Program (Low Temp) Rev]
FROM temp81 LEFT OUTER JOIN [54-80_table]
ON temp81.[54-80] = [54-80_table].Component
WHERE [54-80_table].[BOM_STATUS] IN (‘ACT’,’C-ACT’,’CPROD’,’PROD’,’PPROD’,’QUAL’,’RISK’)UNION ALL
SELECT temp62.*,Null,Null, [54-80_table].[Wafer Sort Test Program (High Temp)], [54-80_table].[Wafer Sort Test Program (High Temp)_REV],
[54-80_table].[Wafer Sort Test Program (Low Temp)], [54-80_table].[Wafer Sort Test Program (Low Temp) Rev]
FROM temp62 LEFT OUTER JOIN [54-80_table] ON temp62.[54-80] = [54-80_table].Component
WHERE [54-80_table].[BOM_STATUS] IN (‘ACT’,’C-CT’,’CPROD’,’PROD’,’PPROD’,’QUAL’,’RISK’)) j
The general query process. The optimization phase is an important one, since we can do something to make the SQL optimizer to right choice. (By updating stats, recompilation, filtered statistics & query hint etc). I will cover that in advanced tuning.
Query parsed –> Normalized as a query tree –> Complied/optimized –> Executed.
The first important two factors need to be looked in plan 1. Cost 2. Actual vs execution number of rows. I will show this in an advanced tuning article in detail about the rows difference, data skew etc and how to solve that.
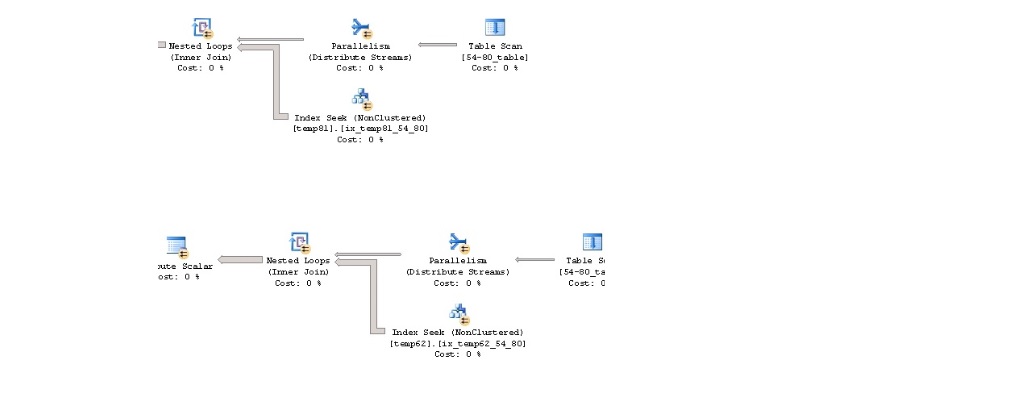
- Check the execution plan, how the query runs behind the screen to get some idea, where the cost is high and scan of the objects, join types etc.
Execution plan shows high cost for parallelism and sort. If we reduce that, it could be run better.
The normal query run time: 46:57 minutes.
- Check the tables involved in the code and get the count (*) – number of records of the table. This will help us to target the big table regarding the fragmentation and statistics up to date.
Total number of records in the table.
select count(*) from temp81 with (nolock) —4984266
select count(*) from temp62 with (nolock) — 6250470
select count(*) from [54-80_table] with (nolock) – 217
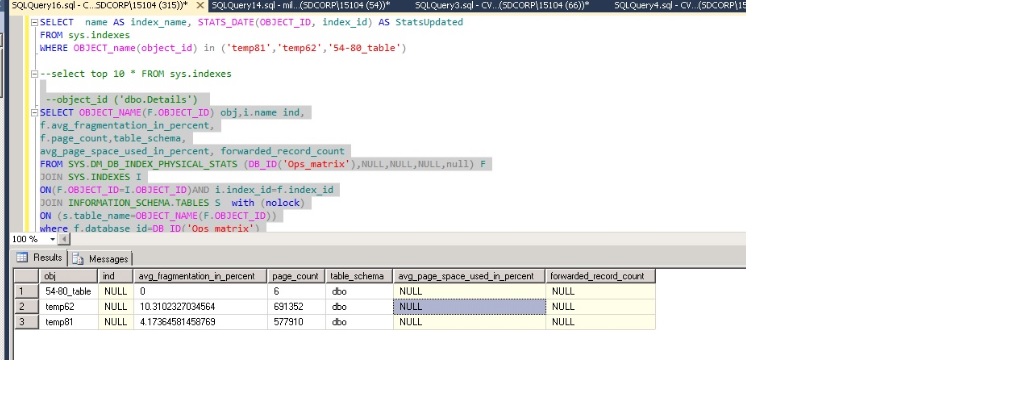
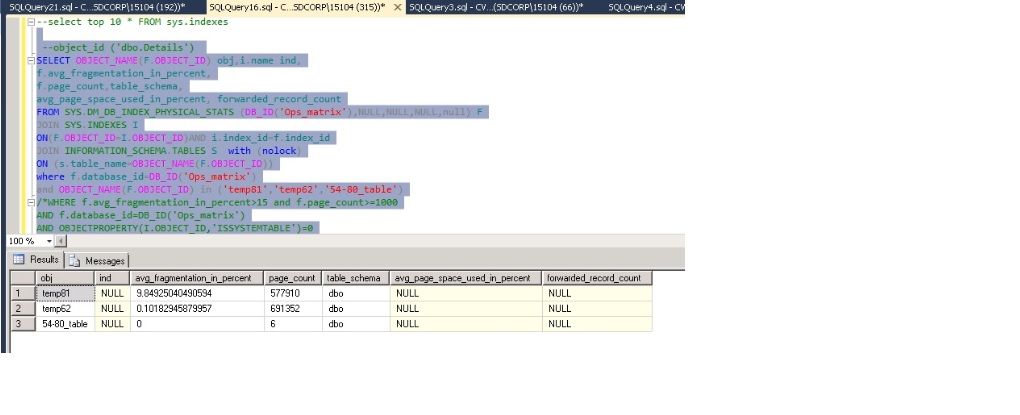
It is a heap and no non-clustered index as well – Statistics is nil maybe, some auto stats for column and fragmentation is low.
SELECT OBJECT_NAME(F.OBJECT_ID) obj,i.name ind,
f.avg_fragmentation_in_percent,
f.page_count,table_schema,
avg_page_space_used_in_percent, forwarded_record_count
FROM SYS.DM_DB_INDEX_PHYSICAL_STATS (DB_ID('Ops_matrix'),NULL,NULL,NULL,null) F
JOIN SYS.INDEXES I
ON(F.OBJECT_ID=I.OBJECT_ID)AND i.index_id=f.index_id
JOIN INFORMATION_SCHEMA.TABLES S with (nolock)
ON (s.table_name=OBJECT_NAME(F.OBJECT_ID))
where f.database_id=DB_ID('Ops_matrix')
and OBJECT_NAME(F.OBJECT_ID) in ('temp81','temp62','54-80_table')
/*WHERE f.avg_fragmentation_in_percent>15 and f.page_count>=1000
AND f.database_id=DB_ID('Ops_matrix')
AND OBJECTPROPERTY(I.OBJECT_ID,'ISSYSTEMTABLE')=0
and alloc_unit_type_desc = 'in_row_data'
order by f.avg_fragmentation_in_percent desc
*/

/*
ALTER TABLE temp81 REBUILD;

UPDATE STATISTICS dbo.temp81
*/
3. Check the table structure of the data type, clustered and non-clustered indexes. Select some top 10 rows and check the values stored in the column, match the data type as well, there are many cases I have seen the data type and table designed badly. Sometimes, the LOB datatype or the larger size has chosen, but the content stored in the column is very small.
Example: create table T10 (n ntext, n1 char( 700))
Note: SQL Server retains the 900-byte limit for the maximum total size of all index key columns.
sp_help ‘tablename’
Almost all of the column of the table is nvarchar(510) and it’s a Unicode characters for business needs.
- Re-index the index and heap table.
There is no index to rebuild. I rebuilt the table/heap and updated the stats for table.
ALTER TABLE temp81 REBUILD;
UPDATE STATISTICS dbo.temp81
- Create the index for the where clause, join columns and see the result.
Created index, but SQL optimizer is not using it. Since, the optimizer is smart and it thinks to retrieve all the data (select *), the table scan is best with some sort for “union all” and “distinct”. Thus, it always chooses a best plan based on cost, what it has from query tree and the statistics. This can happen many cases, the optimizer will skip the indexes.
create index ix_temp81_54_80 on temp81 ([54-80])
create index ix_temp62_54_80 on temp62 ([54-80])
create index ix_54_80_table_Component on [54-80_table] (Component)
create index ix_54_80_table_BOM_STATUS on [54-80_table] (BOM_STATUS)
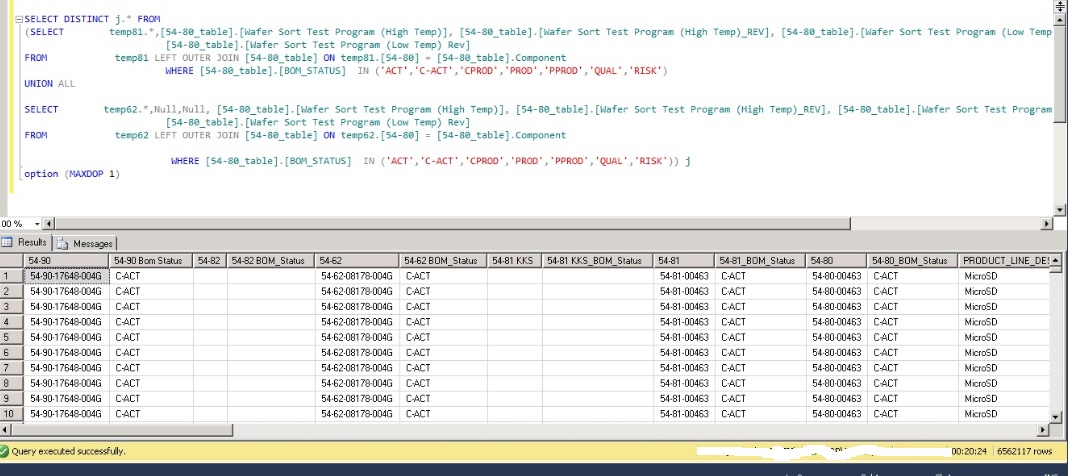
- Try using some hint like, MAXDOP, Index hint etc. I am not saying the parallel plan plan is bad, but there are cases that serial plan works best. And we have seen that, the query is waiting for CXPACKET.
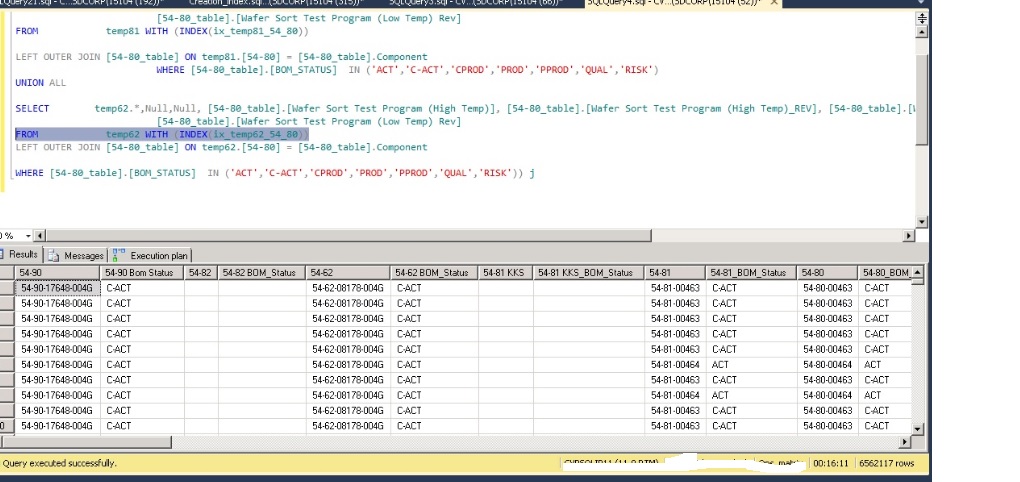
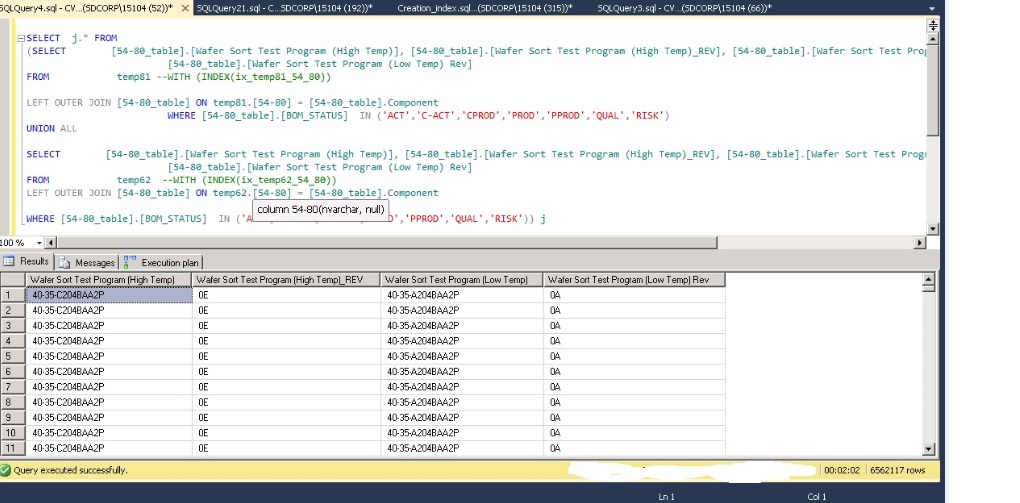
Forcing the Index to use. Still, there are some lookups we can create some covered index, but here the case is different 20+ columns with nvarchar(510).
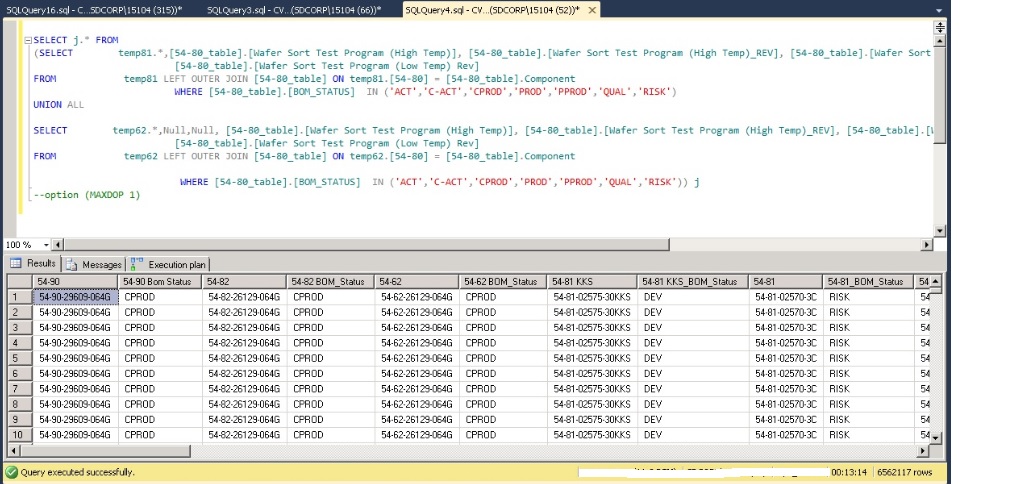
See the query run time is 16:11 minutes.
See the MAXDOP run time is 20:24 minutes.
- Filter the data by some condition, generally by date column.
It does not have date column or any other column to limit the data return.
- Check anything can be changed in the query like, select required column, remove some sort operation and add some filer option.
Removed the distinct – Parallel query run time is 13:14 and by using (MAXDOP 1) – 10:00 minutes.
Removed select * – select only a required columns. The run time is better 02:02 minutes.
- For complex query, take out it as a batch and run it individually. Like, run the two queries separately, run with “union all” and run the full query with “distinct” and see the difference.
Query tuning steps with the execution time for better visibility. It can be reduced even lower than 2 minutes.
| Steps Performed | Execution Time in Minutes |
| Query execution time | 47 |
| Update Stats and Heap Rebuild | 26 |
| Force MAXDOP option | 20 |
| Force Index option | 16 |
| Without Distinct keyword | 10 |
| With Minimal column | 2 |
If the tables temp62 & temp81 has the clustered index, then that is totally different. I am sure that it will run quickly. See my post: https://sqlserverblogforum.com/2016/03/how-important-is-clustered-index-for-a-table/.
As a rule of thumb, every table should have a clustered index and yes, it will speed up all operations are on the table. If you know the table is going to be growing bigger and it does not have a candidate for clustered index, I suggest to create a dumpy identity column with a clustered index. The important factor is how effectively we choose the column for the clustered index. Generally a Surrogate key – Ex: IDENTITY
I do not think that, the user is going to read “6562117” records. And it returns 50 columns as an output. This is what we always say that , do not run some dump code in the production. If you have no condition to limit, at least get some top 1000 records. Think about the query runs 45 minutes and per day it is called 10 times.
If we analysis all in query and database level. Make a benchmark of server resources (CPU, RAM) usage and storage disk and we can check with the infra team to analysis from their side. But, in the real world, that is not the case most of the time. If you really have a good team and they are ready to add resources and make some changes in storage layers, then you can test that. Since, it is very easy to change the storage layers like moving a VMDK partitions from one VMFS/LUN to another, putting into advanced array with SSDs etc. There is nothing can see from end user point of view. Yes, I have a good team and had tested that.
Again, we need to investigate all the points of view and test everything and make a benchmark of it. The database engine is smart and it will pick and work effectively, if we have good schema and query design.
I cannot add all the images, since, already it is a long post. I hope the tuning steps will help. And there are many great links, I have added to the post. Happy learning!
2 Comments
Suresh
Hi,
Thanks Muthu…I learned that which way to handle the performance issue .
Keep your sharing..
Muthukkumaran kaliyamoorthy
Sure Suresh! Thanks for reading. I am planning to write more but, it is hard to sit and write 🙂