What is TempDB and best practice for TempDB
TempDB is the system database and it is per instance. It is a common and shared by all other databases. All the temporary activities are done here and yes, definitely the TempDB will become full and occupy more space depends on the temporary tasks, which we are running. There are many activities can happen in tempDB.
Best practice, create a TempDB in separate disk with the estimated initial file size, those are old days and now most of us using disk array. The spindles and HDDS/SSDs are striped through RAID and shared across LUNs and pools, check with your infra team about the disk configuration from the storage. How the disk is mounted or presented to the server. Is it a dedicated drive (commonly in DAS) or a disk array (commonly in SAN). DAS or SAN, SAN is most common industry standard that is being used. We had both DAS and SAN and some servers local SSDs are mounted only for tempdb, it depends on the database application. Definitely a RAID level has been used, check with that as well. A common recommendation will be RAID 1+0, which is costly. It is always good to know, what kind of storage and storage vendor, we are using it to plan and test that perfectly. Some servers we use advanced Automated Tiered Storage, which is good some without tired etc. DBAs have limited knowledge in the storage, but it is good to learn from our SAN & VM admins :-).
The post has following.
- Query to find what used in tempDB
- Find tempDB contention and fix it
- Reduce the tempDB size
Issue 1:
What are all the activities are done in Tempdb and which is occupying the space
The list is very big (User Objects, Internal Objects & Version Stores) are stored in temporarily in tempDB. Read the TechNet article for more.
If it gets full often, we need to capture the tasks that are hitting to tempDB and need to plan accordingly.
Find out the Tempdb physical file usage
SELECT SUM(unallocated_extent_page_count) AS [free pages],
SUM(unallocated_extent_page_count
+ user_object_reserved_page_count
+ internal_object_reserved_page_count
+ mixed_extent_page_count
+ version_store_reserved_page_count) * (8.0/1024.0/1024.0) AS [Total TempDB SizeInGB]
, SUM(unallocated_extent_page_count * (8.0/1024.0/1024.0)) AS [Free TempDB SpaceInGB]
,unallocated_extent_page_count
,user_object_reserved_page_count
 ,SUM(version_store_reserved_page_count  * (8.0/1024.0/1024.0)) AS [version_store_GB]
,internal_object_reserved_page_count
,mixed_extent_page_count
FROM tempdb.sys.dm_db_file_space_usage
--where [FreeTempDBSpaceInGB]>50
group by unallocated_extent_page_count,user_object_reserved_page_count,internal_object_reserved_page_count,mixed_extent_page_count;
We need to work based on the result from the above code, like version store or internal objects etc.
TempDB DMV:
Monitor the disk space used by the user objects, internal objects, and version stores in the tempdb files.
sys.dm_db_file_space_usage – Returns space usage information for each file in the database.
Allocation or deallocation activity in tempdb at the session or task level
sys.dm_db_session_space_usage – Returns the number of pages allocated and deallocated by each session for the database.
sys.dm_db_task_space_usage – Returns page allocation and deallocation activity by task for the database.
These views can be used to identify large queries, temporary tables, or table variables that are using a large amount of tempdb disk space.
For more:TechNet article diagnosing tempdb Disk Space Problems
Useful queries to find out who is using my TempDB
Following is code originally from Gianluca Sartori and Deepak Biswal. I just copied here. The MSDN article has more code, have a look at it and use the same based on your case. This code really cool and helped me a lot.
The following query will only show the Active request joining from sys.dm_exec_requests DMV. If the query finished, you cannot get that by using this.
;WITH task_space_usage AS (
-- SUM alloc/delloc pages
SELECT session_id,
request_id,
SUM(internal_objects_alloc_page_count) AS alloc_pages,
SUM(internal_objects_dealloc_page_count) AS dealloc_pages
FROM sys.dm_db_task_space_usage WITH (NOLOCK)
WHERE session_id <> @@SPID
GROUP BY session_id, request_id
)
SELECT TSU.session_id,
TSU.alloc_pages * 1.0 / 128 AS [internal object MB space],
TSU.dealloc_pages * 1.0 / 128 AS [internal object dealloc MB space],
EST.text,
-- Extract statement from sql text
ISNULL(
NULLIF(
SUBSTRING(
EST.text,
ERQ.statement_start_offset / 2,
CASE WHEN ERQ.statement_end_offset < ERQ.statement_start_offset THEN 0 ELSE( ERQ.statement_end_offset - ERQ.statement_start_offset ) / 2 END
), ''
), EST.text
) AS [statement text],
EQP.query_plan
FROM task_space_usage AS TSU
INNER JOIN sys.dm_exec_requests ERQ WITH (NOLOCK)
ON TSU.session_id = ERQ.session_id
AND TSU.request_id = ERQ.request_id
OUTER APPLY sys.dm_exec_sql_text(ERQ.sql_handle) AS EST
OUTER APPLY sys.dm_exec_query_plan(ERQ.plan_handle) AS EQP
WHERE EST.text IS NOT NULL OR EQP.query_plan IS NOT NULL
ORDER BY 3 DESC, 5 DESC
The following query will show the session space usage. If the session is closed, you cannot get that by using this.
SELECT DES.session_id AS [SESSION ID],
Db_name(DDSSU.database_id) AS [DATABASE Name],
host_name AS [System Name],
program_name AS [Program Name],
login_name AS [USER Name],
status,
( user_objects_alloc_page_count * 8 ) AS
[SPACE Allocated FOR USER Objects (in KB)],
( user_objects_dealloc_page_count * 8 ) AS
[SPACE Deallocated FOR USER Objects (in KB)],
( internal_objects_alloc_page_count * 8 ) AS
[SPACE Allocated FOR Internal Objects (in KB)],
( internal_objects_dealloc_page_count * 8 ) AS
[SPACE Deallocated FOR Internal Objects (in KB)],
cpu_time AS [CPU TIME (in milisec)],
total_scheduled_time AS
[Total Scheduled TIME (in milisec)],
total_elapsed_time AS
[Elapsed TIME (in milisec)],
( memory_usage * 8 ) AS [Memory USAGE (in KB)],
CASE is_user_process
WHEN 1 THEN 'user session'
WHEN 0 THEN 'system session'
END AS [SESSION Type],
row_count AS [ROW COUNT]
FROM tempdb.sys.dm_db_session_space_usage AS DDSSU
INNER JOIN sys.dm_exec_sessions AS DES
ON DDSSU.session_id = DES.session_id
ORDER BY [space allocated for internal objects (in kb)] DESC
If you find the session ID, which is using more temp space. Pass the session ID to find the code which is taking more TempDB. One of my other case, A poorly written query used more than 100GB of space.
SELECT TEXT
FROM sys.dm_exec_connections
CROSS APPLY sys.dm_exec_sql_text(most_recent_sql_handle)
WHERE session_id = (181)
Issue 2:
How to solve the Tempdb contention and improve the performance
This is another one issue with tempDB that, we generally get.
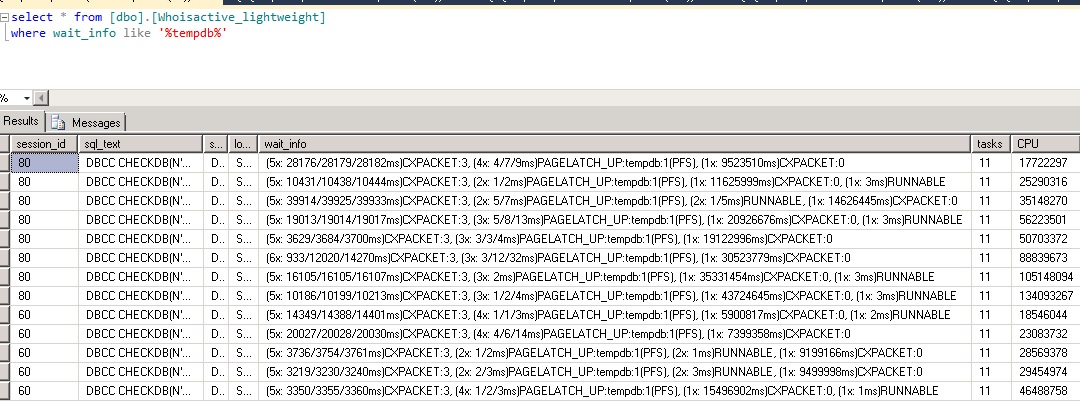
Easy way to find the tempdb contention by using Whoisactive and more workout for TempDB.
You can also see the overall system wait type.
Latch contention can occur in tempDB allocation pages of GAM, SGAM and PFS. It is a common one, but when we have a lot of hits, it creates a performance issue, since the wait queue increases.
If you see a lot wait_type is PAGELATCH or PAGEIOLATCH with tempDB: PFS, GAM and SGAM ([wait_type]:[database_name]:file_id), then we have contention that needs to be fixed to improve the performance.
We can fix the contention by creating more data file with equal size, more data file will give more allocation pages (GAM, SGAM and PFS per data file).
If you cannot create a file equal size, since the one file can be very big, we can use trace flag 1117. It forces other files in the filegroup to grow it. It applies to other databases as well.
The easiest way to alleviate tempdb allocation contention is to enable trace flag 1118 and to add more tempdb data files.
http://www.sqlskills.com/blogs/paul/correctly-adding-data-files-tempdb/
The number of data files is it depends. Recommendation from Paul Randal.
Then if you have less than 8 logical cores, create the same number of data files as logical cores. If you have more than 8 logical cores, create 8 data files and then add more in chunks of 4 if you still see PFS contention. Make sure all the tempdb data files are the same size too.
Temporary and permanent fix
We can reduce the file size by shrinking the files. Try to shrink the files first, if it is not shrinking, free the procedure cache and shrink again. You can FREEPROCCACHE more than one time until, you see or want to reduce space used by files.
Note: Freeproccache will clear the procedure cache and will cache the data newly.
It is a temporary fix and it does not need a recycle of SQL service. Shrinking the tempDB is fine, but not more frequently, since, it may leads an external disk fragmentation.
USE TEMPDB;
GO
DBCC SHRINKFILE (TEMPDEV,10000) -- Initial size with 10 GB
DBCC FREEPROCCACHE
DBCC SHRINKFILE (TEMPDEV,10000)
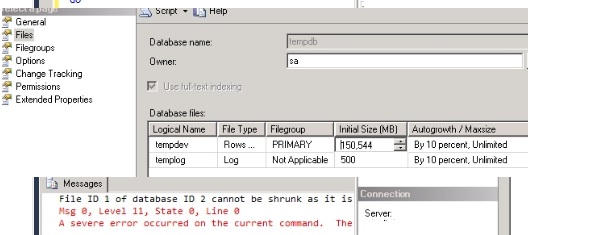
When we run more FREEPROCCACHE with a shrink, sometimes you can see the following error, Not sure the error looks like an internal file allocation, it can be fixed by increasing the file size + some MB. Ex: 1000MB file can increased by 1005MB.
File ID 1 of database ID 2 cannot be shrunk as it is either being shrunk by another process or is empty.
Msg 0, Level 11, State 0, Line 0
A severe error occurred on the current command. The results, if any, should be discarded.
Sometimes the free cache will not help, when you do not have a free space in the file. Use the following query and check the free space.
USE [tempdb]
SELECT
[name]
,CONVERT(NUMERIC(10,2),ROUND([size]/128.,2)) AS [Size]
,CONVERT(NUMERIC(10,2),ROUND(FILEPROPERTY([name],'SpaceUsed')/128.,2)) AS [Used]
,CONVERT(NUMERIC(10,2),ROUND(([size]-FILEPROPERTY([name],'SpaceUsed'))/128.,2)) AS [Unused]
FROM [sys].[database_files]
Another case, I had a row versioning enabled for the database which prevent the TempDB shrinking, and disabled it temporarily and shrink it. It helped me.
--check which dbs are in snapshot isoation mode
select name,is_read_committed_snapshot_on,snapshot_isolation_state, snapshot_isolation_state_desc,* from sys.databases
--where is_read_committed_snapshot_on =1
order by 1
--Disable snapshot isolation
alter database DBname set READ_COMMITTED_SNAPSHOT off with rollback after 30 seconds
go
use tempdb
go
dbcc shrinkfile (tempdev, 10000) --Shrink with 10GB
go
select (size*8)/1024.0 as FileSizeMB from sys.database_files --check new size
go
--Enable snapshot isolation
alter database DBname set READ_COMMITTED_SNAPSHOT on with rollback after 30 seconds
go
You can also move tempDB from drive to drive where you have free space and restart the instance.
The permanent fix is hard one, we need to get the query or tasks, which all are hitting the tempDB and need to tune those. In my case, it is an 8 TB database and when the predefined maintenance plan runs, it occupies all the tempDB space. I used different method Ola Hallengren’s script. It was a fantastic script, we can have more control than the maintenance plan. I have skipped the non- clustered index and some historical VLT table, which is not a critical one. It reduced the tempDB space and job run time as well. I had a small contention and I did not create more data files.
Note: My case is different and the very large table is total dump data. I removed from checkDB. Make sure, before you remove any of your tables. Skipping non-clustered index is not always good, instead you can run split checkDB: https://sqlserverblogforum.com/vldb/vldb-very-large-database-dbcc-checkdb/
In another case, one of the developer code uses all tempDB space and it has more contention as well and yes it got reduced after creating a more data files. Use the whoisactive and other script to find out the exact issue and fix based on what you have in your the system. Since, I mixed with two more issues in this post.


3 Comments
Vinoth
Hi Muthu,
It is good information. You put all together.
Keeping writing it man! If you are participating user group let me know, i will join it..
Muthukkumaran kaliyamoorthy
Thanks man! Sure, I will let you know. I have not recently gone Chennai user group.
Ramesh
Good