DBA wants to collect metrics and analysis them and present them to management to get something done by using the data (to check performance issue, benchmark for migration etc) and it is all about data and metric nowadays. How to collect them and show as a presentation.
Two parts are there: 1. You can setup only Perfmon, T-SQL and use excel 2. Setup perfmon, T-SQL and configure SSRS.
Tools needed: Perfmon.msc, Relog.Exe, database engine, PowerShell & CMD.
Steps:
- Create two notepad and save it any drive (performance.lst, server.lst). The performance notepad will have counter details and server notepad will have server name
- Create one CMD file called createlogs.cmd. Createlogs cmd will have script to create perfmon data collector in a single shot with all specified counter and in the perfmon tool. This will create folder and place the BLG counter files in the path. (The counter details and CMD scripts are bottom of this post)
- Once data collected, convert to csv for easy read.
- Load the CSV to data table using script to read and make a easy trend and analysis.
- Additionally, if you have SSRS you can configure to view data as graph trend..
Part:1
Setup PerfMon and collect data
This can be done by perfmon windows utility.
Verify SQL performance logging counters are already installed on — run — perfmon.msc
Ensure there are a few gigabytes free on the D: drive. The createlogs.cmd script will try in D (You can change the D: drive to any drive, just use ctrl+H to repalce in 11 place – D: in 9 places, D$ in one place and set DESTDRV=drive name)
Save a notepad as server.lst that should contain target servers list
Save a notepad as performance.lst that should contain all important counters
Save createlogs.cmd as cmd.
Copy all three files into server with all name, counter and code.
Open command prompt as administrator– (Change the directory CD and dir)
CD /d C:\Users\muthu\Desktop\SQLDBA\Perfmon — Change this location
You will see C:\Users\muthu\Desktop\SQLDBA\Perfmon>
Type Dir
example – C:\Users\muthu\Desktop\SQLDBA\Perfmon>dir
You will see all files.Now type createlogs.cmd
example – C:\Users\muthu\Desktop\SQLDBA\Perfmon>createlogs.cmd
Enter it. This will create folder and schedule in perfmon data collector. make sure to verify all.
Verification: Open perfmon.msc and verify counters are green and working good.
Sample performance.lst notepad should contain following counters
You can add more counters based on your environment and server.
\IPv4(*)\*
\TCPv4(*)\*
\Network Interface(*)\*
\Network Interface(*)\Packets Received/sec
\Network Interface(*)\Packets Sent/sec
\Network Interface(*)\Bytes Received/sec
\Network Interface(*)\Bytes Sent/sec
\Network Interface(*)\Bytes Total/sec
\Processor(_Total)\*
\Processor(_Total)\% Processor Time
\Processor(_Total)\% User Time
\Processor(_Total)\% Privileged Time
\Processor(_Total)\% Interrupt Time
\Processor(_Total)\% DPC Time
\Memory\*
\Memory\Pages/sec
\Memory\Committed Bytes
\Memory\Pool Nonpaged Bytes
\Memory\Pool Paged Bytes
\Memory\Pages Input/sec
\Memory\Pages Output/sec
\Memory\Available MBytes
\Memory\%Committed Bytes in Use
\Memory\Available Bytes
\Memory\Page Faults/sec
\Paging File(_Total)\% Usage
\PhysicalDisk(*)\*
\PhysicalDisk(_Total)\*
\LogicalDisk(*)\*
\LogicalDisk(_Total)\*
\PhysicalDisk(_Total)\Avg. Disk Queue Length
\PhysicalDisk(_Total)\Avg. Disk sec/Read
\PhysicalDisk(_Total)\Avg. Disk sec/Write
\PhysicalDisk(_Total)\Disk Read Bytes/sec
\PhysicalDisk(_Total)\Disk Reads/sec
\PhysicalDisk(_Total)\Disk Write Bytes/sec
\PhysicalDisk(_Total)\Disk Writes/sec
\PhysicalDisk(_Total)\% Idle Time
\PhysicalDisk(_Total)\% Disk Time
\Process:(*)\IO Data Bytes/Sec
\System\*
\System\Processes
\System\Threads
\System\System Up Time
\System\Processor Queue Length
\SQLAgent:Alerts\*
\SQLAgent:Statistics\*
\SQLServer:Access Methods\*
\SQLServer:Backup Device\*
\SQLServer:Buffer Manager\*
\SQLServer:Database Mirroring\*
\SQLServer:Exec Statistics(*)\*
\SQLServer:General Statistics\*
\SQLServer:Latches\*
\SQLServer:Locks(*)\*
\SQLServer:Memory Manager\*
\SQLServer:SQL Statistics\*
\SQLServer:Transactions\*
\SQLServer:Wait Statistics(*)\*
\SQLServer:Cursor Manager by Type(*)\*
\SQLServer:Databases(*)\*
\SQLServer:SQL Errors(*)\*
\Process(_Total)\*
\Process(_Total)\Private Bytes
\Process(_Total)\Working Set
% free space
AggCacheKB
Cleaner memory KB
Concurrent DM queries
Current connections
Current entries
Current KB
Current latch waits
Current lock waits
Current locks
Current models processing
Current number of cached evaluation nodes
Current user sessions
Dimension property files
Long parsing job queue length
Memory limit hard KB
Memory size bytes
Memory size rows
Memory usage KB
Notifications/sec
Processing pool IO job queue length
Processing pool job rate
Query pool job queue length
Query pool job rate
Quota KB
Short parsing job queue
Total bytes sent
Total calculation cache registered
Total cells calculated
Total deadlocks detected
Total dimension queries
Total direct hits
Total evictions
Total EXISTING
Total failures
Total inserts
Total lookups
Total measure group queries
Total misses
Total network round trips
Total NON EMPTY for calculated members
Total NON EMPTY
Total partitions – indexes
Total partitions
Total predictions
Total queries answered
Total queries from cache direct
Total queries from file
Total queries
Total requests
Total rows – indexes
Total rows converted
Total rows read
Total rows sent
Total rows written
Total rows
Total successes
BLOB bytes read
BLOB bytes written
BLOB files in use
Buffer memory
Buffers in use
Buffers spooled
Flat buffer memory
Flat buffers in use
Private buffer memory
Private buffers in use
Private bytes
Rows read
Rows written
SSIS package instances
SQLServer:SSIS Pipeline 10.0:Buffers in use
SQLServer:SSIS Pipeline 10.0:Buffers spooled
SQLServer:SSIS Pipeline 10.0:Private buffer memory
Working set
Active connections
Active sessions – Web service
Active sessions – Windows service
Bytes received total
Bytes sent total
Logon successes total
Memory pressure state
Report requests – Web service
Report requests – Windows service
Requests executing
Requests total
Tasks queued
Total cache hits- Web service
Total cache hits – Windows service
Total cache misses – Web service
Total cache misses – Windows service
Total deliveries
Total events
Total memory cache hits – Web service
Total memory cache hits – Windows service
Total processing failures – Web service
Total processing failures – Windows service
Total reports executed – Web service
Total reports executed – Windows service
Total requests – Web service
Total requests – Windows service
Look on the perfmon GUI and make sure you have processor, Disk, Memory and network counters, if anything missed, you can add it here as well.
I have copied BI counters from here https://www.sqlshack.com/bi-performance-counters/. Please add as per your servers.
createlogs.cmd — Save this as a CMD file — Given by my windows team.
Note:
You can change the D: drive to any drive, just use ctrl+H to repalce D: in 9 places , D$ in one place and finally set DESTDRV=D.
For syntax correction, please change double quote ” next to enter button. Ex: if not “%1” == “” set COUNTERFILE=%1
@echo off
echo **************************************************************************
echo * CREATELOGS.CMD
echo *
echo * This command configures a perfmon collection log on the target server(s)
echo * specified in server.lst.
echo * The configured counters are taken from performance.lst unless
echo * a filename is provided on the command line.
echo *
echo * Note: You must have administrator rights on the target servers.
echo **************************************************************************
SET COUNTERFILE=performance.lst
if not "%1" == "" set COUNTERFILE=%1
if "%2" == "" set LISTFILE=server.lst
if not "%2" == "" set LISTFILE=%2

if not exist "%COUNTERFILE%" goto ERRBadFile
for /F %%i in (%LISTFILE%) do call :CreateLog %%i %COUNTERFILE%
goto End

:ERRBadFile
echo ERROR: Performance counter file could not be found!
goto End

:CreateLog
rem If no server specified then quit
if "%1" == "" echo ERROR: No target server specified
if "%1" == "" goto End
if "%2" == "" echo ERROR: No performance counters specified
if "%2" == "" goto End

rem Attach to target server (must have admininistrator credentials)
rem Try D: first and if that doesn’t work then try C:
net use D: /d 2>nul
set DESTDRV=d
net use D: \%1\D$ /p:no
if not exist D:*.* set DESTDRV=c
if not exist D:*.* net use D: \%1\c$ /p:no
if not exist D:*.* goto ERRConnect

rem Create a directory off of the root of the target drive to hold the perf logs.
rem This records samples on 60 second intervals.
md D:\logs\perflogs 2>nul
@echo on
logman stop %1_test -s %1 2>&1
@sleepr 5
logman delete %1_test -s %1 1>nul 2>&1
@sleepr 5
logman create counter %1_test -s %1 -o %DESTDRV%:\logs\perflogs\%1_test -v mmddhhmm -f bin -cf %2 -si 00:05:00 -cnf 24:00:00
@sleepr 5
logman start %1_test -s %1
@echo off
net use D: /d 2>nul
goto End

:ERRConnect
echo Error connecting to %1
pause
goto End

:End
Note: When server reboots your data collector could stop, you need to use task scheduler to start – logman start “ServerName_Test” –1) create a basic task 2) schedule when the computer starts 3) In the program/script copy and paste “logman” and in Add aruguments — writename of the job i.e. start “ServerName_Test”‘ click yes.
Once you have data collected and you can convert to csv using PowerShell or relog CMD window.
Analysis the data
1. Convert to csv
Easy way to convert and load using T SQL. Use the following code to dynamically generate the result.
Go to the server create folder called CSV in the same place.
- The following will give code to convert blg to csv.
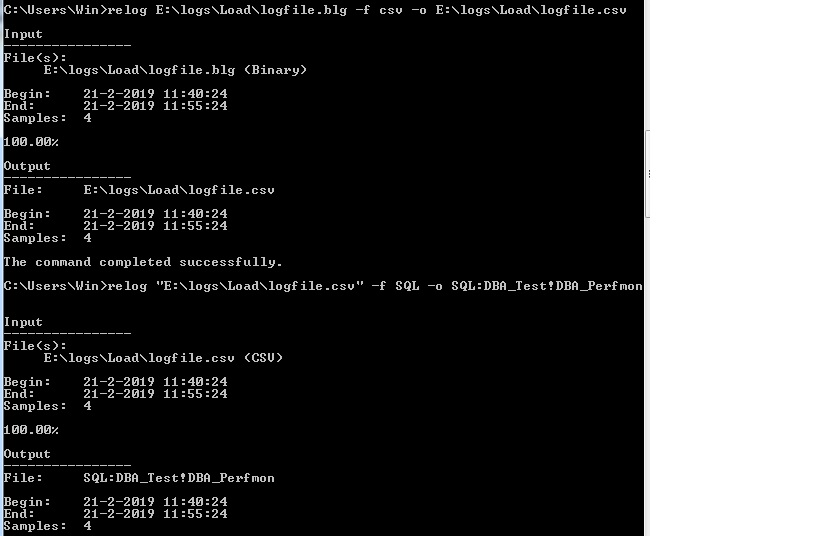
Ex: “relog F:\logs\perflogs\server_test_02100122.blg -f csv -o F:\logs\perflogs\csv\Server_test_02100122.csv”
-- Check xp_cmdshell is already enabled or not, if enabled no problem, otherwise enable and do your work and disable it using sp_configure 'xp_cmdshell',0
sp_configure 'show advan',1;reconfigure
sp_configure 'xp_cmdshell'
 -- Enabled means 1

-- To Enable
sp_configure 'xp_cmdshell',1;reconfigure

--drop table #tbl_perf_blg
create table #tbl_perf_blg ( Name varchar (500))
insert into #tbl_perf_blg
exec master..xp_cmdshell 'dir F:\logs\perflogs /b'

select 'relog F:\logs\perflogs\'+Name +' -f csv -o F:\logs\perflogs\csv\'+ replace (Name,'blg','csv')
from #tbl_perf_blg where name is not null
Open CMD as administrator –> Get the result from select query and save it in notepad as BlgCSV_Convert.cmd and run it from command line cd /d physical location and run the BlgCSV_Convert.cmd.
2. Load to SQL database
- The following will give code load csv into database.
Ex: relog F:\logs\perflogs\csv\server_test_12100514.csv -f SQL -o SQL:DBA_Test!DBA_Perfmon
--drop table #tbl_perf_csv
create table #tbl_perf_csv ( Name varchar (500))
insert into #tbl_perf_csv
exec master..xp_cmdshell 'dir F:\logs\perflogs\csv\*.csv /b'

select 'relog F:\logs\perflogs\csv\'+Name +' -f SQL -o SQL:DBA_Test!DBA_Perfmon'
from #tbl_perf_csv where name is not null
-- disable xp_cmdshell
sp_configure 'xp_cmdshell',0;reconfigure
We can do this by using PowerShell or windows utility relog.exe and it will create tables and load a data from CSV. We need an ODBC user DSN to connect the database to loading a data using relog.exe.
Create a database called DBA_Perfmon.
RDP the SQL server server –> administrative tools –Data source– 64 bit (not 32 bit) user DSN –Add–SQL server–Finish and fill the details Name as DBA_test and pass server name –> click next –>Change default database to DBA_Perfmon –> Next –>finish — Test data source — click ok.
Once that done, we can import the csv perfmon data to SQL databases by using PowerShell or CMD.
Load all CSV files one by one
Create one batch Load_csv_to_DB.cmd
Ex: CD /d F:\logs\perflogs
Run/open Load_csv_to_DB.cmd
If we have many files and we can load one by one or merge as a single csv and can load by script.
Example Load to Database
Ex: relog “F:\logs\Load\logfile.csv” -f SQL -o SQL:DBA_Test!DBA_Perfmon
DBA_Test is a DSN and DBA_Perfmon is database name.
The specified log file type has not been installed on this computer csv windows 7 relog, if you get this use Perfmon Logs with Relog.exe to convert it. Better to load one by one, since it has some limitation and combining will fail.
Once the data loaded check the database DBA_perfmon you have three tables created – CounterData, CounterDetails,DisplayToID and it holds the data.
3. To use excel to make graph:
Select query to copy and paste the result to excel.
/*
select min(counterDateTime),max(counterDateTime) from [dbo].[CounterData] with (nolock)

select top 10 * From counterdata
*/
use DBA_Perfmon
go
--select @@servername
SELECT
counterdetails.machinename,
       counterdetails.objectname,
       counterdetails.countername,
       --counterdetails.countertype,
       counterdetails.instancename,
       Datediff(minute, st.starttime, Cast(LEFT(counterdata.counterdatetime, Len(counterdata.counterdatetime) - 8) AS DATETIME)) AS interval,
       Avg(counterdata.countervalue) AS Avg_countervalue
       --Avg(counterdata.countervalue) /1024/1024 AS counterValues_GB
       --counterdata.countervalue AS counterValues
       ,Cast(LEFT(counterdata.counterdatetime, Len(counterdata.counterdatetime) - 8)AS DATETIME) as Load_Time
FROM   counterdata
INNER JOIN counterdetails ON counterdata.counterid = counterdetails.counterid,
(
SELECT counterdetails.machinename,
Min(Cast(LEFT(counterdata.counterdatetime, Len(counterdata.counterdatetime) - 8)AS DATETIME))AS startTime
FROM   counterdata
INNER JOIN counterdetails ON counterdata.counterid = counterdetails.counterid
GROUP  BY machinename
) AS st

-------================================
WHERE  st.machinename = counterdetails.machinename
--AND counterdata.counterdatetime >'2017-11-01 14:56:00.000'
-------================================ OBJECTNAME
--and objectname in ('PhysicalDisk')
AND CounterName in ('Avg. Disk sec/Transfer')
--AND CounterName in ('Disk Bytes/sec', 'Avg. Disk sec/Transfer','IO Data Bytes/sec')
--and counterdata.counterdatetime between '2017-11-20'and'2017-11-21'
/*
and Datediff(minute, st.starttime, Cast(LEFT(counterdata.counterdatetime, Len(counterdata.counterdatetime) - 8) AS DATETIME))  in(
'187082',
'186657',
'186657',
'186652',
'186652'

)
*/
--and InstanceName in ('J','N','E','L')
--and InstanceName not in ('J','N','E','L')

--and objectname in ('memory')
--AND CounterName in ('Available MBytes')
/*
AND objectname in ('Paging File','Processor','Process(sqlservr) Process(msmdsrv)'
,'System','PhysicalDisk','Memory','SQLServer:Memory Manager','SQLServer:Buffer Manager'
,'SQLServer:Databases','SQLServer:General Statistics','SQLServer:SQL Statistics'
,'SQLServer:Access Methods','LogicalDisk')
*/
/************************************************************ COUNTER ******************/

-------================================ CPU
--AND CounterName in ('Processor Queue Length','% Usage','% Processor Time','% Privilege Time','Context Switches/sec') -- CPU

-------================================ Disk
--2017-11-07 00:20:00.000 & 2017-11-06 23:15:00.000

--and

--AND CounterName in ('Avg ms/read','Avg ms/write','Avg. Disk sec/Read','Avg. Disk sec/Write','Avg. Disk Queue Length')
--,'Disk Read Bytes/sec','Disk Write Bytes/sec') -- Disk
-------================================ general filter
--AND CounterName in( 'Free Pages/sec' , 'Free List Stalls/sec' ) -- general filter
-------================================ RAM
/*
AND CounterName in ('Available MBytes','Memory Grants Pending','Total Server Memory (KB)','Target Server Memory (KB)'
,'Free Memory (KB)','Stolen Server Memory (KB)','Stolen Pages/sec','Lazy writes/sec'
,'Page life expectancy','Lazy writes/sec','Page reads/sec','Page writes/sec','Buffer cache hit ratio'
,'Free Pages/sec' , 'Free List Stalls/sec','Pages/sec'
)-- RAM
*/
/*
-------================================ Transaction
AND CounterName in ('Log Flush Waits/sec','User Connections','Batch Requests/Sec','SQL Server: SQL Statistics','SQL Re-Compilations/sec'
,'Forwarded Records/sec','Full Scans/sec','Index Searches/sec'
) -- Transaction
*/
-------================================ Date
--and Cast(LEFT(counterdata.counterdatetime, Len(counterdata.counterdatetime) - 8)AS DATETIME) between '2017-08-07' and '2017-08-09'

GROUP  BY counterdetails.machinename,
          counterdetails.objectname,
          counterdetails.countername,
          counterdetails.countertype,
          counterdetails.instancename,
          Datediff(minute, st.starttime, Cast(LEFT(counterdata.counterdatetime, Len(counterdata.counterdatetime) - 8) AS DATETIME))
          ,counterdata.countervalue
 ,Cast(LEFT(counterdata.counterdatetime, Len(counterdata.counterdatetime) - 8)AS DATETIME)

having counterdata.countervalue>0.01
--having counterdata.countervalue/1024/1024<50
order by Cast(LEFT(counterdata.counterdatetime, Len(counterdata.counterdatetime) - 8)AS DATETIME) desc
--order by CounterValue

--Avg(counterdata.countervalue)/1024/1024


--==================================
 -- get the counter name for object/ counter
 /*

 use [DBA_Perfmon]

 -- object
 select CounterName ,objectname from counterdetails  where objectname like '%user%'
 group by CounterName,objectname

 -- counter
 select CounterName ,objectname from counterdetails  where countername like '%user%'
 group by CounterName,objectname


 select CounterName ,objectname from counterdetails
 group by CounterName,objectname

 select instancename,count(*) from counterdetails group by instancename
 select * from counterdetails where instancename is null


 */
1.Copy and paste data from table results with column and replace \ 2. Change COLUMN date format to “right date and time” 3. Select A2 and click Insert menu select PivotTable and choose pivot chart 4. Click ok 5. Axis Field “date” 6. In values field “add counter value” in the value select value field settings and choose max .If needed filtering it the counter names but good to do this each counter separately.
Just convert as csv and make a piovt in excel https://www.mssqltips.com/sqlservertip/1515/creating-sql-server-performance-based-reports-using-excel/
Additional t-SQL code to view Detailed data
-- To find the ObjectName,CounterName,InstanceName
select ObjectName,CounterName,InstanceName from CounterDetails
JOIN CounterData ON CounterData.CounterID = CounterDetails.CounterID  JOIN DisplayToID ON DisplayToID.GUID = CounterData.GUID
where ObjectName like '%Buffer%'
group by ObjectName,CounterName,InstanceName

SELECT MachineName,CounterName,
   CONVERT(DATETIME, CONVERT(VARCHAR(16), CounterDateTime)) as [Date],
   AVG(CounterValue) as Average,
   MIN(CounterValue) as Minimum,
   MAX(CounterValue) as Maximum
FROM CounterDetails
   JOIN CounterData ON CounterData.CounterID = CounterDetails.CounterID
   JOIN DisplayToID ON DisplayToID.GUID = CounterData.GUID
WHERE ObjectName like '%Physical%'
GROUP BY MachineName,CounterName,
   CONVERT(DATETIME, CONVERT(VARCHAR(16), CounterDateTime))


   SELECT  MachineName ,
        CounterName ,
        InstanceName ,
        CounterValue ,
        CounterDateTime ,
        DisplayString
FROM    dbo.CounterDetails cdt
        INNER JOIN dbo.CounterData cd ON cdt.CounterID = cd.CounterID
        INNER JOIN DisplayToID d ON d.GUID = cd.GUID
WHERE   MachineName like '%K%'
AND ObjectName like '%buffer%' AND cdt.CounterName like '%Page life expectancy%'  --AND cdt.InstanceName like '%_Total%'
ORDER BY CounterDateTime

----------------------Aggregate
SELECT  MachineName ,
        CounterName ,
        InstanceName ,
        MIN(CounterValue) AS minValue ,
        MAX(CounterValue) AS maxValue ,
        AVG(CounterValue) AS avgValue ,
        DisplayString
FROM    dbo.CounterDetails cdt
        INNER JOIN dbo.CounterData cd ON cdt.CounterID = cd.CounterID
        INNER JOIN dbo.DisplayToID d ON d.GUID = cd.GUID
WHERE    MachineName like '%K%'
AND ObjectName like '%buffer%' AND cdt.CounterName like '%Page life expectancy%'  --AND cdt.InstanceName like '%_Total%'
and CounterDateTime between '2017-07-12 00:00:03.923' and '2017-07-12 23:59:03.923'
GROUP BY MachineName ,CounterName ,InstanceName , DisplayString--, CounterDateTime


--select getdate()
Part:2 (Optional)
Configure SSRS
Installing SSRS
If you have not installed SSRS, install the service first and configure it.
Go to the software folder and double click the setup – click installation in the left side –New SQL server standalone or add features on existing installation – Next and next – select “Add features to an existing instance of SQL server

Next – Install only – Install.
Configure SSRS
Once, installation completed. Open SSRS from configuration manager. Change the service account and apply –web services URL apply – database creation and apply – Report manager URL and apply.
Create tables and SPs
Create 2 databases – [DBA_REPORT_CODE], [DBA_Perfmon] and 2 SPs on DBA_REPORT_CODE – [USP_RS_PERFMON], [USP_RS_PERFMON_INSTANCENAME]
USP_RS_PERFMON — Perfmon data report display
USE [DBA_REPORT_CODE]
GO

/****** Object:  StoredProcedure [dbo].[USP_RS_PERFMON]    Script Date: 21-02-2019 18:05:03 ******/
SET ANSI_NULLS ON
GO

SET QUOTED_IDENTIFIER ON
GO


-- EXEC USP_RS_PERFMON '\\KW3L1P41',@OBJECTNAME='PhysicalDisk',@COUNTERNAME='Avg. Disk sec/Transfer',@UPLOAD_DATE='2016-01-05 00:20:00.000'

create PROC [dbo].[USP_RS_PERFMON]
(@SERVERNAME VARCHAR(100),@OBJECTNAME VARCHAR (100), @COUNTERNAME VARCHAR(100), --@INSTANCENAME VARCHAR(100)=NULL,
@UPLOAD_DATE VARCHAR(100))
AS
/*
Contact:     muthukkumaran kaliyamoorhty
Description: Generate report of perfmon data
changelog:
date         coder                          description
2018-15-june     muthukkumaran kaliyamoorhty     initial
*/

BEGIN
SELECT DBA_PERFMON..COUNTERDETAILS.MACHINENAME,
       DBA_PERFMON..COUNTERDETAILS.OBJECTNAME,
       DBA_PERFMON..COUNTERDETAILS.COUNTERNAME,
       DBA_PERFMON..COUNTERDETAILS.INSTANCENAME,
       DATEDIFF(MINUTE, ST.STARTTIME, CAST(LEFT(DBA_PERFMON..COUNTERDATA.COUNTERDATETIME, LEN(DBA_PERFMON..COUNTERDATA.COUNTERDATETIME) - 8) AS DATETIME)) AS INTERVAL,
       AVG(DBA_PERFMON..COUNTERDATA.COUNTERVALUE) AS COUNTERVALUE
     ,CAST(LEFT(DBA_PERFMON..COUNTERDATA.COUNTERDATETIME, LEN(DBA_PERFMON..COUNTERDATA.COUNTERDATETIME) - 8)AS DATETIME) AS LOAD_TIME
FROM   DBA_PERFMON..COUNTERDATA
INNER JOIN DBA_PERFMON..COUNTERDETAILS ON DBA_PERFMON..COUNTERDATA.COUNTERID = DBA_PERFMON..COUNTERDETAILS.COUNTERID,
(
SELECT DBA_PERFMON..COUNTERDETAILS.MACHINENAME,
MIN(CAST(LEFT(DBA_PERFMON..COUNTERDATA.COUNTERDATETIME, LEN(DBA_PERFMON..COUNTERDATA.COUNTERDATETIME) - 8)AS DATETIME))AS STARTTIME
FROM   DBA_PERFMON..COUNTERDATA
INNER JOIN DBA_PERFMON..COUNTERDETAILS ON DBA_PERFMON..COUNTERDATA.COUNTERID = DBA_PERFMON..COUNTERDETAILS.COUNTERID
GROUP  BY MACHINENAME
) AS ST

-------================================
WHERE  ST.MACHINENAME = DBA_PERFMON..COUNTERDETAILS.MACHINENAME

-------================================ OBJECTNAME
/*
AND OBJECTNAME = 'LOGICALDISK'
AND COUNTERNAME ='AVG. DISK SEC/TRANSFER'
AND INSTANCENAME='H:'
AND COUNTERDATETIME>='2017-11-05 00:20:00.000'
*/
AND DBA_PERFMON..COUNTERDETAILS.MACHINENAME= @SERVERNAME
AND OBJECTNAME = @OBJECTNAME
AND COUNTERNAME = @COUNTERNAME
--AND INSTANCENAME=@INSTANCENAME
AND DBA_PERFMON..COUNTERDATA.COUNTERDATETIME>=@UPLOAD_DATE

GROUP  BY DBA_PERFMON..COUNTERDETAILS.MACHINENAME,
          DBA_PERFMON..COUNTERDETAILS.OBJECTNAME,
          DBA_PERFMON..COUNTERDETAILS.COUNTERNAME,
          DBA_PERFMON..COUNTERDETAILS.COUNTERTYPE,
          DBA_PERFMON..COUNTERDETAILS.INSTANCENAME,
          DATEDIFF(MINUTE, ST.STARTTIME, CAST(LEFT(DBA_PERFMON..COUNTERDATA.COUNTERDATETIME, LEN(DBA_PERFMON..COUNTERDATA.COUNTERDATETIME) - 8) AS DATETIME))
      ,DBA_PERFMON..COUNTERDATA.COUNTERVALUE
 ,CAST(LEFT(DBA_PERFMON..COUNTERDATA.COUNTERDATETIME, LEN(DBA_PERFMON..COUNTERDATA.COUNTERDATETIME) - 8)AS DATETIME)

HAVING DBA_PERFMON..COUNTERDATA.COUNTERVALUE>0.01
--HAVING DBA_PERFMON..COUNTERDATA.COUNTERVALUE/1024/1024<50
ORDER BY CAST(LEFT(DBA_PERFMON..COUNTERDATA.COUNTERDATETIME, LEN(DBA_PERFMON..COUNTERDATA.COUNTERDATETIME) - 8)AS DATETIME) DESC

END
GO
USP_RS_PERFMON_INSTANCENAME – With instance name of perfmon data display
USE [DBA_REPORT_CODE]
GO

/****** Object:  StoredProcedure [dbo].[USP_RS_PERFMON_INSTANCENAME]    Script Date: 21-02-2019 18:07:37 ******/
SET ANSI_NULLS ON
GO

SET QUOTED_IDENTIFIER ON
GO


-- EXEC USP_RS_PERFMON_INSTANCENAME '\\KW3L1P41','LOGICALDISK','AVG. DISK SEC/TRANSFER','H:','2016-11-21 07:15:00.000'

create PROC [dbo].[USP_RS_PERFMON_INSTANCENAME]
(@SERVERNAME VARCHAR(100),@OBJECTNAME VARCHAR (100), @COUNTERNAME VARCHAR(100), @INSTANCENAME VARCHAR(100)=NULL,
@UPLOAD_DATE VARCHAR(100)=NULL)
AS
/*
Contact:     muthukkumaran kaliyamoorhty
Description: Generate report of perfmon data
changelog:
date         coder                          description
2018-15-june     muthukkumaran kaliyamoorhty     initial
*/

BEGIN
SELECT DBA_PERFMON..COUNTERDETAILS.MACHINENAME,
       DBA_PERFMON..COUNTERDETAILS.OBJECTNAME,
       DBA_PERFMON..COUNTERDETAILS.COUNTERNAME,
       DBA_PERFMON..COUNTERDETAILS.INSTANCENAME,
       DATEDIFF(MINUTE, ST.STARTTIME, CAST(LEFT(DBA_PERFMON..COUNTERDATA.COUNTERDATETIME, LEN(DBA_PERFMON..COUNTERDATA.COUNTERDATETIME) - 8) AS DATETIME)) AS INTERVAL,
       AVG(DBA_PERFMON..COUNTERDATA.COUNTERVALUE) AS COUNTERVALUE
     ,CAST(LEFT(DBA_PERFMON..COUNTERDATA.COUNTERDATETIME, LEN(DBA_PERFMON..COUNTERDATA.COUNTERDATETIME) - 8)AS DATETIME) AS LOAD_TIME
FROM   DBA_PERFMON..COUNTERDATA
INNER JOIN DBA_PERFMON..COUNTERDETAILS ON DBA_PERFMON..COUNTERDATA.COUNTERID = DBA_PERFMON..COUNTERDETAILS.COUNTERID,
(
SELECT DBA_PERFMON..COUNTERDETAILS.MACHINENAME,
MIN(CAST(LEFT(DBA_PERFMON..COUNTERDATA.COUNTERDATETIME, LEN(DBA_PERFMON..COUNTERDATA.COUNTERDATETIME) - 8)AS DATETIME))AS STARTTIME
FROM   DBA_PERFMON..COUNTERDATA
INNER JOIN DBA_PERFMON..COUNTERDETAILS ON DBA_PERFMON..COUNTERDATA.COUNTERID = DBA_PERFMON..COUNTERDETAILS.COUNTERID
GROUP  BY MACHINENAME
) AS ST

-------================================
WHERE  ST.MACHINENAME = DBA_PERFMON..COUNTERDETAILS.MACHINENAME

-------================================ OBJECTNAME
AND DBA_PERFMON..COUNTERDETAILS.MACHINENAME= @SERVERNAME
AND OBJECTNAME = @OBJECTNAME
AND COUNTERNAME = @COUNTERNAME
AND INSTANCENAME=@INSTANCENAME
AND DBA_PERFMON..COUNTERDATA.COUNTERDATETIME>=@UPLOAD_DATE

GROUP  BY DBA_PERFMON..COUNTERDETAILS.MACHINENAME,
          DBA_PERFMON..COUNTERDETAILS.OBJECTNAME,
          DBA_PERFMON..COUNTERDETAILS.COUNTERNAME,
          DBA_PERFMON..COUNTERDETAILS.COUNTERTYPE,
          DBA_PERFMON..COUNTERDETAILS.INSTANCENAME,
          DATEDIFF(MINUTE, ST.STARTTIME, CAST(LEFT(DBA_PERFMON..COUNTERDATA.COUNTERDATETIME, LEN(DBA_PERFMON..COUNTERDATA.COUNTERDATETIME) - 8) AS DATETIME))
      ,DBA_PERFMON..COUNTERDATA.COUNTERVALUE
 ,CAST(LEFT(DBA_PERFMON..COUNTERDATA.COUNTERDATETIME, LEN(DBA_PERFMON..COUNTERDATA.COUNTERDATETIME) - 8)AS DATETIME)

--HAVING DBA_PERFMON..COUNTERDATA.COUNTERVALUE>0.1
--HAVING DBA_PERFMON..COUNTERDATA.COUNTERVALUE/1024/1024<50
ORDER BY CAST(LEFT(DBA_PERFMON..COUNTERDATA.COUNTERDATETIME, LEN(DBA_PERFMON..COUNTERDATA.COUNTERDATETIME) - 8)AS DATETIME) DESC

END
GO
You can check the report by using the SP- EXEC USP_RS_PERFMON ‘\win-pc’,@OBJECTNAME=’PhysicalDisk’,@COUNTERNAME=’Avg. Disk sec/Transfer’,@UPLOAD_DATE=’2016-01-05 00:20:00.000′. (OR) you can directly query the tables by adjusting the SP codes.
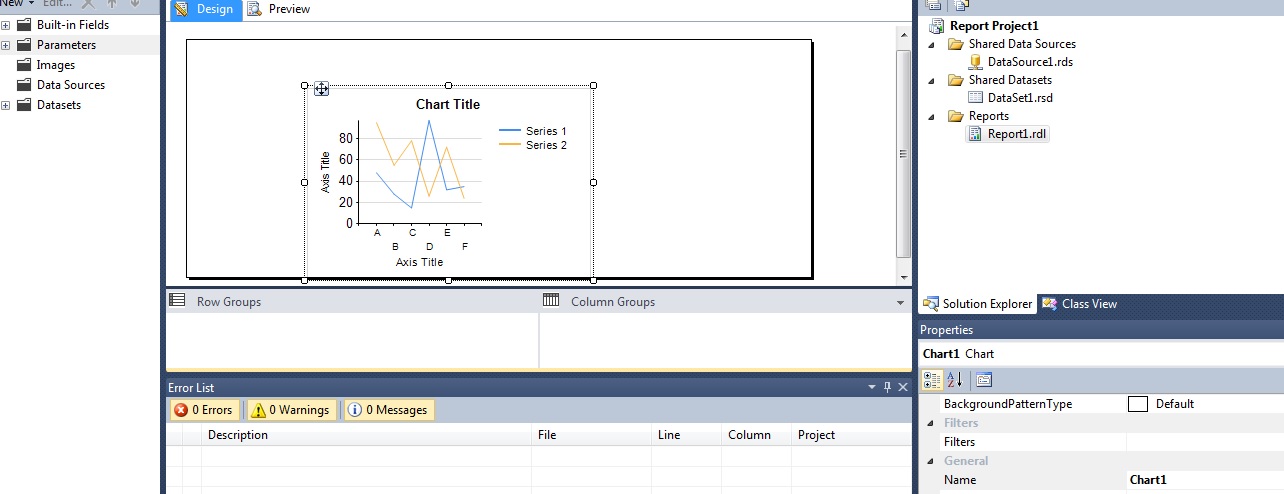
Build reports
Use business intelligence studio and design a report and deploy it or import the RDL files.
This should be separate post, since it has lot of images to create reports. (Will write later)
Create a shared data source and data set. Create two reports one for without instance name and one is with instance name of perfmon counters.
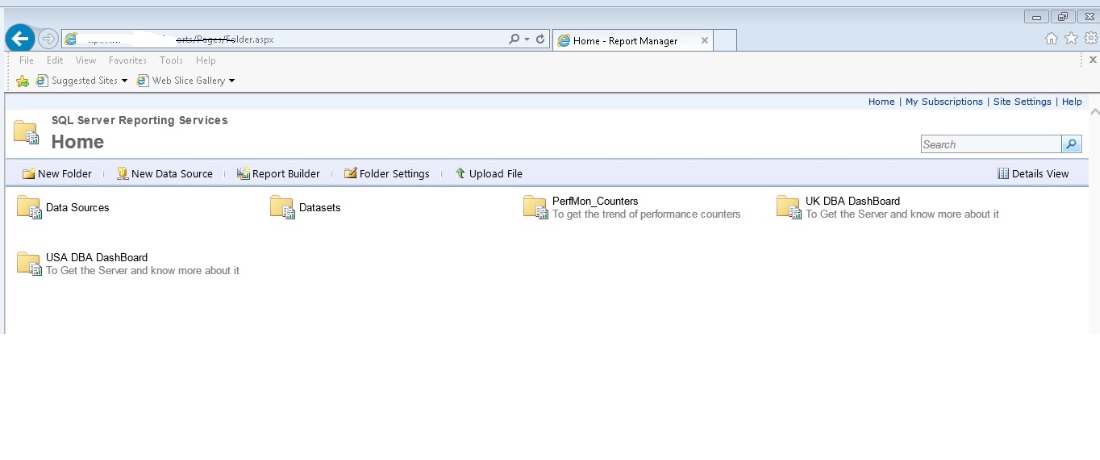
View graph from SSRS
Create three folders called perfmon_counters and data source and data set. Upload all in the right folders and link each by using manages option.
The report server cannot process the report. The reference for the shared dataset ‘DataSet1’ is not valid. (rsInvalidDataSetReference)
This means the data set and data source is not linked with the reports.
Pass the parameters in the report and view the values in a graph.


Perfmon baseline / Benchmark values.
| Object | Counter | Rule of Thumb |
| Paging File | % Usage | < 70% |
| Processor | % Processor Time | <= 80% |
| Processor | % Privilege Time | < 40% of % Processor Time |
| Process(sqlservr) Process(msmdsrv) | % Processor Time | < 80% |
| System | Processor Queue Length | < 2 |
| System | Context Switches/sec | < 1500 |
| Physical Disk | Avg ms/read | < 8 |
| Physical Disk | Avg ms/write | <1 |
| Physical Disk | Avg. Disk sec/Read | <12 sec |
| Physical Disk | Avg. Disk sec/Write | < 2 sec |
| Logical/Physical | Avg. Disk sec/Transfer | 0.005-0.010 sec |
| Avg. Disk sec/Read | 0.005-0.010 sec | |
| Avg. Disk sec/Write | 0.005-0.010 sec | |
| Memory | Available Mbytes | =>300 |
| Memory | Page faults/sec | |
| Memory | Pages/sec | <20 |
| SQL Server: Memory Manager | Memory Grants Pending | ~0 |
| SQL Server: Memory Manager | Total Server Memory (KB) | |
| SQL Server: Memory Manager | Target Server Memory (KB) | |
| SQL Server: Buffer Manager | Free List Stalls/sec | < 2 |
| SQL Server: Buffer Manager | Free Pages/sec | |
| SQL Server: Buffer Manager | Free Memory (KB) | |
| SQL Server: Buffer Manager | Stolen Server Memory (KB) | |
| SQL Server: Buffer Manager | Stolen Pages/sec | Proportionate to Batch Requests /sec |
| SQL Server: Buffer Manager | Lazy writes/sec | <20 (Should be zero) |
| SQL Server: Buffer Manager | Page life expectancy | >300 |
| SQL Server: Buffer Manager | Page reads/sec | <90 |
| SQL Server: Buffer Manager | Page writes/sec | |
| SQL Server: Databases | Log Flush Waits/sec | ~0 |
| SQL Server: General Statistics | User Connections | Proportionate to Batch Requests /sec |
| SQL Server: SQL Statistics | Batch Requests/Sec | Proportionate to workload |
| SQL Server: SQL Statistics | SQL Server: SQL Statistics | < 10% of Batch Requests/Sec |
| SQL Server: SQL Statistics | SQL Re-Compilations/sec | < 10% of SQL Compil-ations/sec |
| SQL Server:Access Methods | Forwarded Records/sec | < 10 per 100 Batch Requests/Sec |
| SQL Server:Access Methods | Full Scans/sec | Index Searches/sec)/(Full Scans/sec) > 1000 |
| SQL Server:Access Methods | Index Searches/sec | Index Searches/sec)/(Full Scans/sec) > 1000 |
I cannot add all the images and steps here, since it will be long post, if anyone needed info feel free to contact me.
3 Comments
kishore kumar
Hi Muthu,
Thanks for scripts and steps. I have configured and uploaded to database, i could not configure ssrs,can you help me or send documents if any. I have shared my email in other comments.
Muthukkumaran Kaliyamoorthy
Hi Kishore,
I will share you. If you could not configure ssrs, you can run the t-sql with filters and can view or copy it excel – power pivot etc.
SELECT counterdetails.machinename,
counterdetails.objectname,
counterdetails.countername,
–counterdetails.countertype,
counterdetails.instancename,
Datediff(minute, st.starttime, Cast(LEFT(counterdata.counterdatetime, Len(counterdata.counterdatetime) – 8) AS DATETIME)) AS interval,
Avg(counterdata.countervalue) AS countervalue
–Avg(counterdata.countervalue) /1024/1024 AS counterValues_GB
–counterdata.countervalue AS counterValues
,Cast(LEFT(counterdata.counterdatetime, Len(counterdata.counterdatetime) – 8)AS DATETIME) as Load_Time
FROM counterdata
INNER JOIN counterdetails ON counterdata.counterid = counterdetails.counterid,
(
SELECT counterdetails.machinename,
Min(Cast(LEFT(counterdata.counterdatetime, Len(counterdata.counterdatetime) – 8)AS DATETIME))AS startTime
FROM counterdata
INNER JOIN counterdetails ON counterdata.counterid = counterdetails.counterid
GROUP BY machinename
) AS st
WHERE st.machinename = counterdetails.machinename
AND objectname in (‘Paging File’,’Processor’,’Process(sqlservr) Process(msmdsrv)’
,’System’,’PhysicalDisk’,’Memory’,’SQLServer:Memory Manager’,’SQLServer:Buffer Manager’
,’SQLServer:Databases’,’SQLServer:General Statistics’,’SQLServer:SQL Statistics’
,’SQLServer:Access Methods’)
–AND CounterName in (‘Processor Queue Length’,’% Usage’,’% Processor Time’,’% Privilege Time’,’Context Switches/sec’) — CPU
–AND CounterName in (‘Avg ms/read’,’Avg ms/write’,’Avg. Disk sec/Read’,’Avg. Disk sec/Write’) — Disk
–AND CounterName in( ‘Target Server Memory (KB)’,’Total Server Memory (KB)’) — general filter
–/*
AND CounterName in (‘Available Mbytes’,’Memory Grants Pending’,’Total Server Memory (KB)’,’Target Server Memory (KB)’
,’Free Memory (KB)’,’Stolen Server Memory (KB)’,’Stolen Pages/sec’,’Lazy writes/sec’
,’Page life expectancy’,’Lazy writes/sec’,’Page reads/sec’,’Page writes/sec’,’Buffer cache hit ratio’
,’Free Pages/sec’ , ‘Free List Stalls/sec’,’Pages/sec’
)– RAM
—/
/
AND CounterName in (‘Log Flush Waits/sec’,’User Connections’,’Batch Requests/Sec’,’SQL Server: SQL Statistics’,’SQL Re-Compilations/sec’
,’Forwarded Records/sec’,’Full Scans/sec’,’Index Searches/sec’
) — Transaction
*/
and Cast(LEFT(counterdata.counterdatetime, Len(counterdata.counterdatetime) – 8)AS DATETIME) between ‘2017-08-07’ and ‘2017-08-09’
GROUP BY counterdetails.machinename,
counterdetails.objectname,
counterdetails.countername,
counterdetails.countertype,
counterdetails.instancename,
Datediff(minute, st.starttime, Cast(LEFT(counterdata.counterdatetime, Len(counterdata.counterdatetime) – 8) AS DATETIME))
,counterdata.countervalue
,Cast(LEFT(counterdata.counterdatetime, Len(counterdata.counterdatetime) – 8)AS DATETIME)
–having counterdata.countervalue>0
–having counterdata.countervalue/1024/1024<50
order by Cast(LEFT(counterdata.counterdatetime, Len(counterdata.counterdatetime) – 8)AS DATETIME) desc
–Avg(counterdata.countervalue)/1024/1024
— get the counter name for object/ counter
/*
— object
select CounterName ,objectname from counterdetails where objectname like ‘%Memory%’
group by CounterName,objectname
— counter
select CounterName ,objectname from counterdetails where countername like ‘%memory%’
group by CounterName,objectname
select CounterName ,objectname from counterdetails
group by CounterName,objectname
Target Server Memory (KB)
Thread-safe memory objects waits
Total Server Memory (KB)
*/
Mathan
Hi,
I got this error by loading csv to database via ODBC. can you help
Error: A SQL failure occurred. Check the application event log for any errors.