How to read execution plan to improve poorly performing queries
Execution plan is optimizer’s calculation of how the query will be executed by creating the best low-cost query plan (if it is already in the cache, it will reuse). SQL server is cost based optimizer. Meaning, the optimizer decides based on CPU, I/O and statistics etc and creates a plan and returns the results.
Up to date statistics is very important one to create a more accurate plan.
We can view this in GUI and text both will be helpful, when the scenario come in.
Types: Estimated and Actual execution plan – both will be helpful.
Estimated plan: It will just give you an estimated cost and rows etc., without running a query. This is useful, when you have a query that is running very long.
Example:
- You have a query which is running one day. Then you have to wait to see the actual execution plan after one day.
- You have a query which has some DML like delete, if you run the code which will delete the records.
So for this type of case we can use the estimated plan.
Actual plan: – It is a plan generated actual execution of the query. You have to enable and run the query to get it.
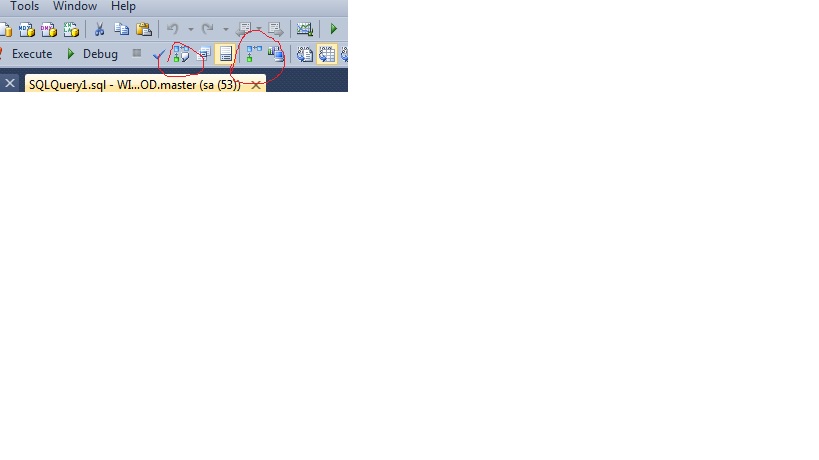
Important components in execution plan to note and read
We need to read a execution plan from right to left and top to bottom.
- Check the cost, where it’s going high try to analyze why it’s going high.
-
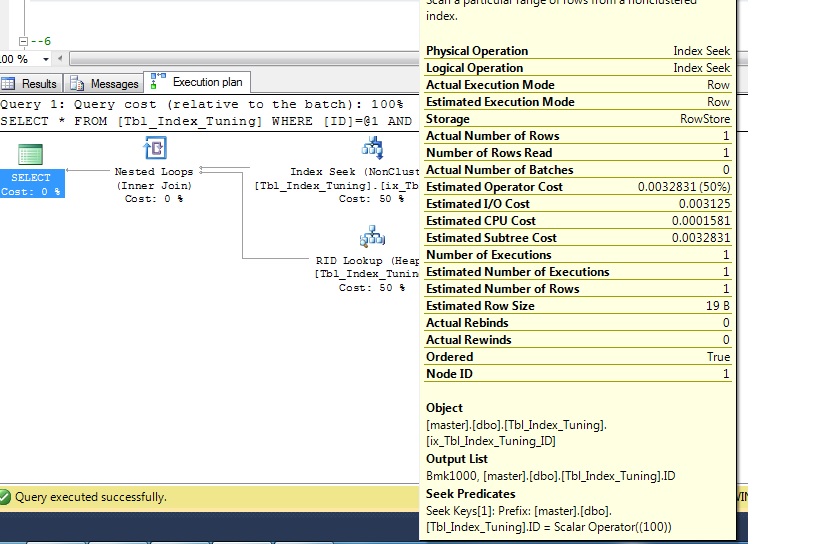
ToolTip – If we move to each image operator a pop-up window will come, we can know more about it.
-
Check the estimated number of rows vs actual number of rows, this should be equal, otherwise the statistics are out dated. We need to update the statistics manually or we have a skew data.
Code:
UPDATE STATISTICS dbo.Table_Name (Index_Name) with fullscan
- Thick dark big line arrows -The thickness of the arrow is the amount of data being generated, just move to the arrow.
-
Check the number of execution – If it’s high then it is doing iteration/cursor.
-
Operator – Each icon / image is operator.
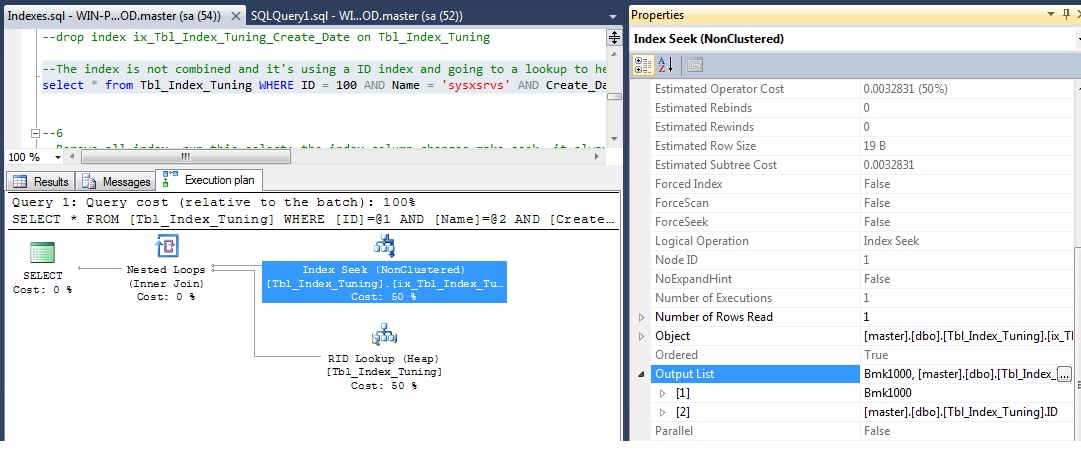
- Operator Properties – You can see each in Properties window right side. You can copy the output select columns to include that in non-clustered index.
-
Predicates – Means where clause columns. In general, all predicates needs to be indexed.
-
Output list – Select list column names. All the output columns needs to added in INCLUDE clause of the index.
create index ix_tbl_Inventory_Upload_all on tbl_Inventory_Upload (id,owner,Application) include (Version,Build,Category,Edition,Login)
- Important operator- seek, scan, lookup etc
As long as the operator has a low cost, we can leave it. Lookup and scan can be fixed by fully covering index, lookup mostly by include clause of index.
Advanced Query hints and optimization – Further tuning, we can look at the Histogram statistics or can use some hint optimizer, maxdop, filtered index, filtered statistics ect for PSP issues. (this will be separate post)
- Node ID – just ordinal number to read and the big plan have more nodes child & parent.
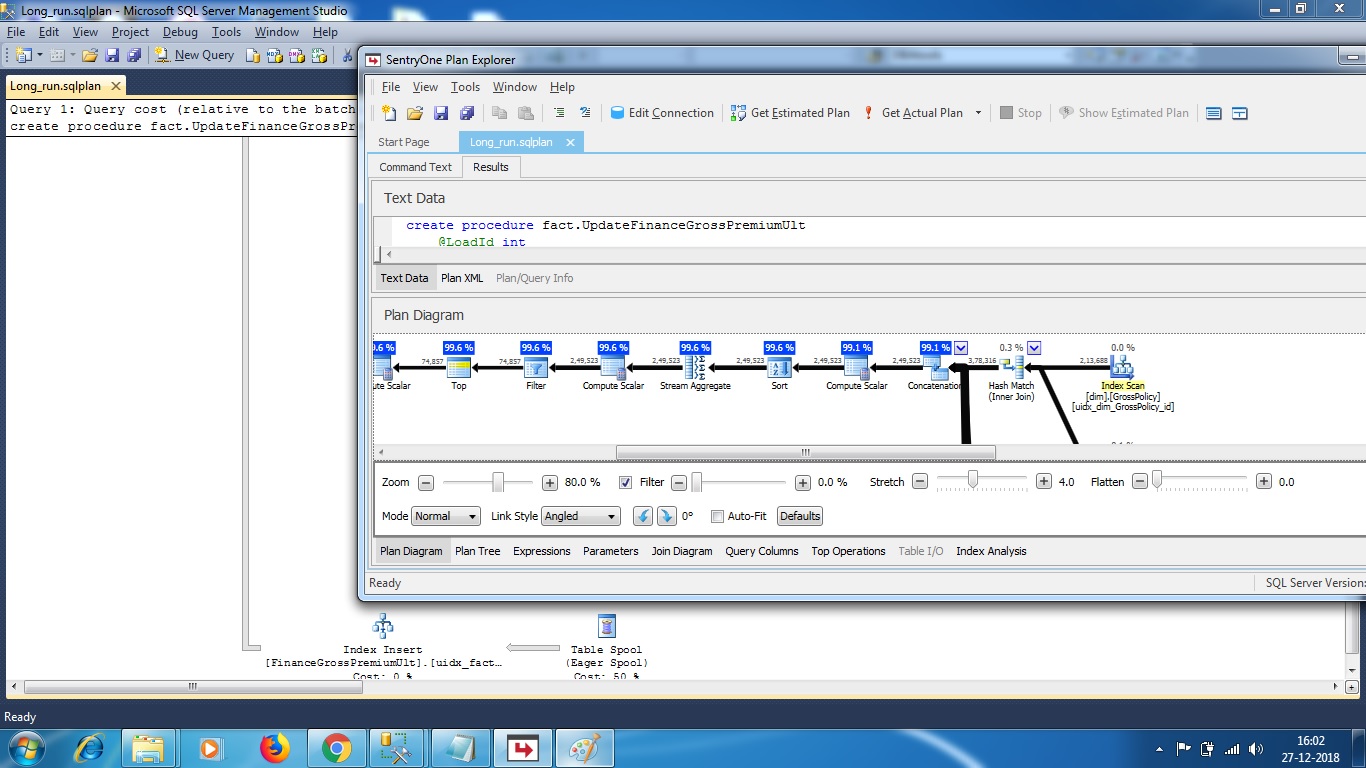
I started using Plan Explorer to read a larger plan. It has many things like cumulative cost to read easily.
Thanks to Grant Fritchey , where I started more about execution plan of SQL server.